SurfCheck Lab · Seabed Atlas

What's under the wave

49 breaks, each drawn from up to three kinds of evidence and honest about where the evidence runs out. Tap any map to open it, then pinch, scroll or drag to look closer.

See these breaks in 3D Run swell over them in the Wave Lab How SurfCheck works

Brown: uncovers with the tideReef and beach mapped from dozens of satellite images, each tagged with the measured tide height at that moment, or from airborne LiDAR where a survey reaches the shore. Checked against LiDAR at Bundoran: typically within 0.4 m.
Blue: surveyed seabedThe national survey for that coast: INFOMAR in Ireland, Environment Agency LiDAR and UKHO soundings in England, NSW Marine LiDAR in Australia, NOAA's compiled model in the US. Darker is deeper.
Hatched: filled inNobody has measured this band. It is a smooth fill between the two measured edges, so the outline is real and the depths are a best guess.

Co. Donegal · A-frame reef, left and right

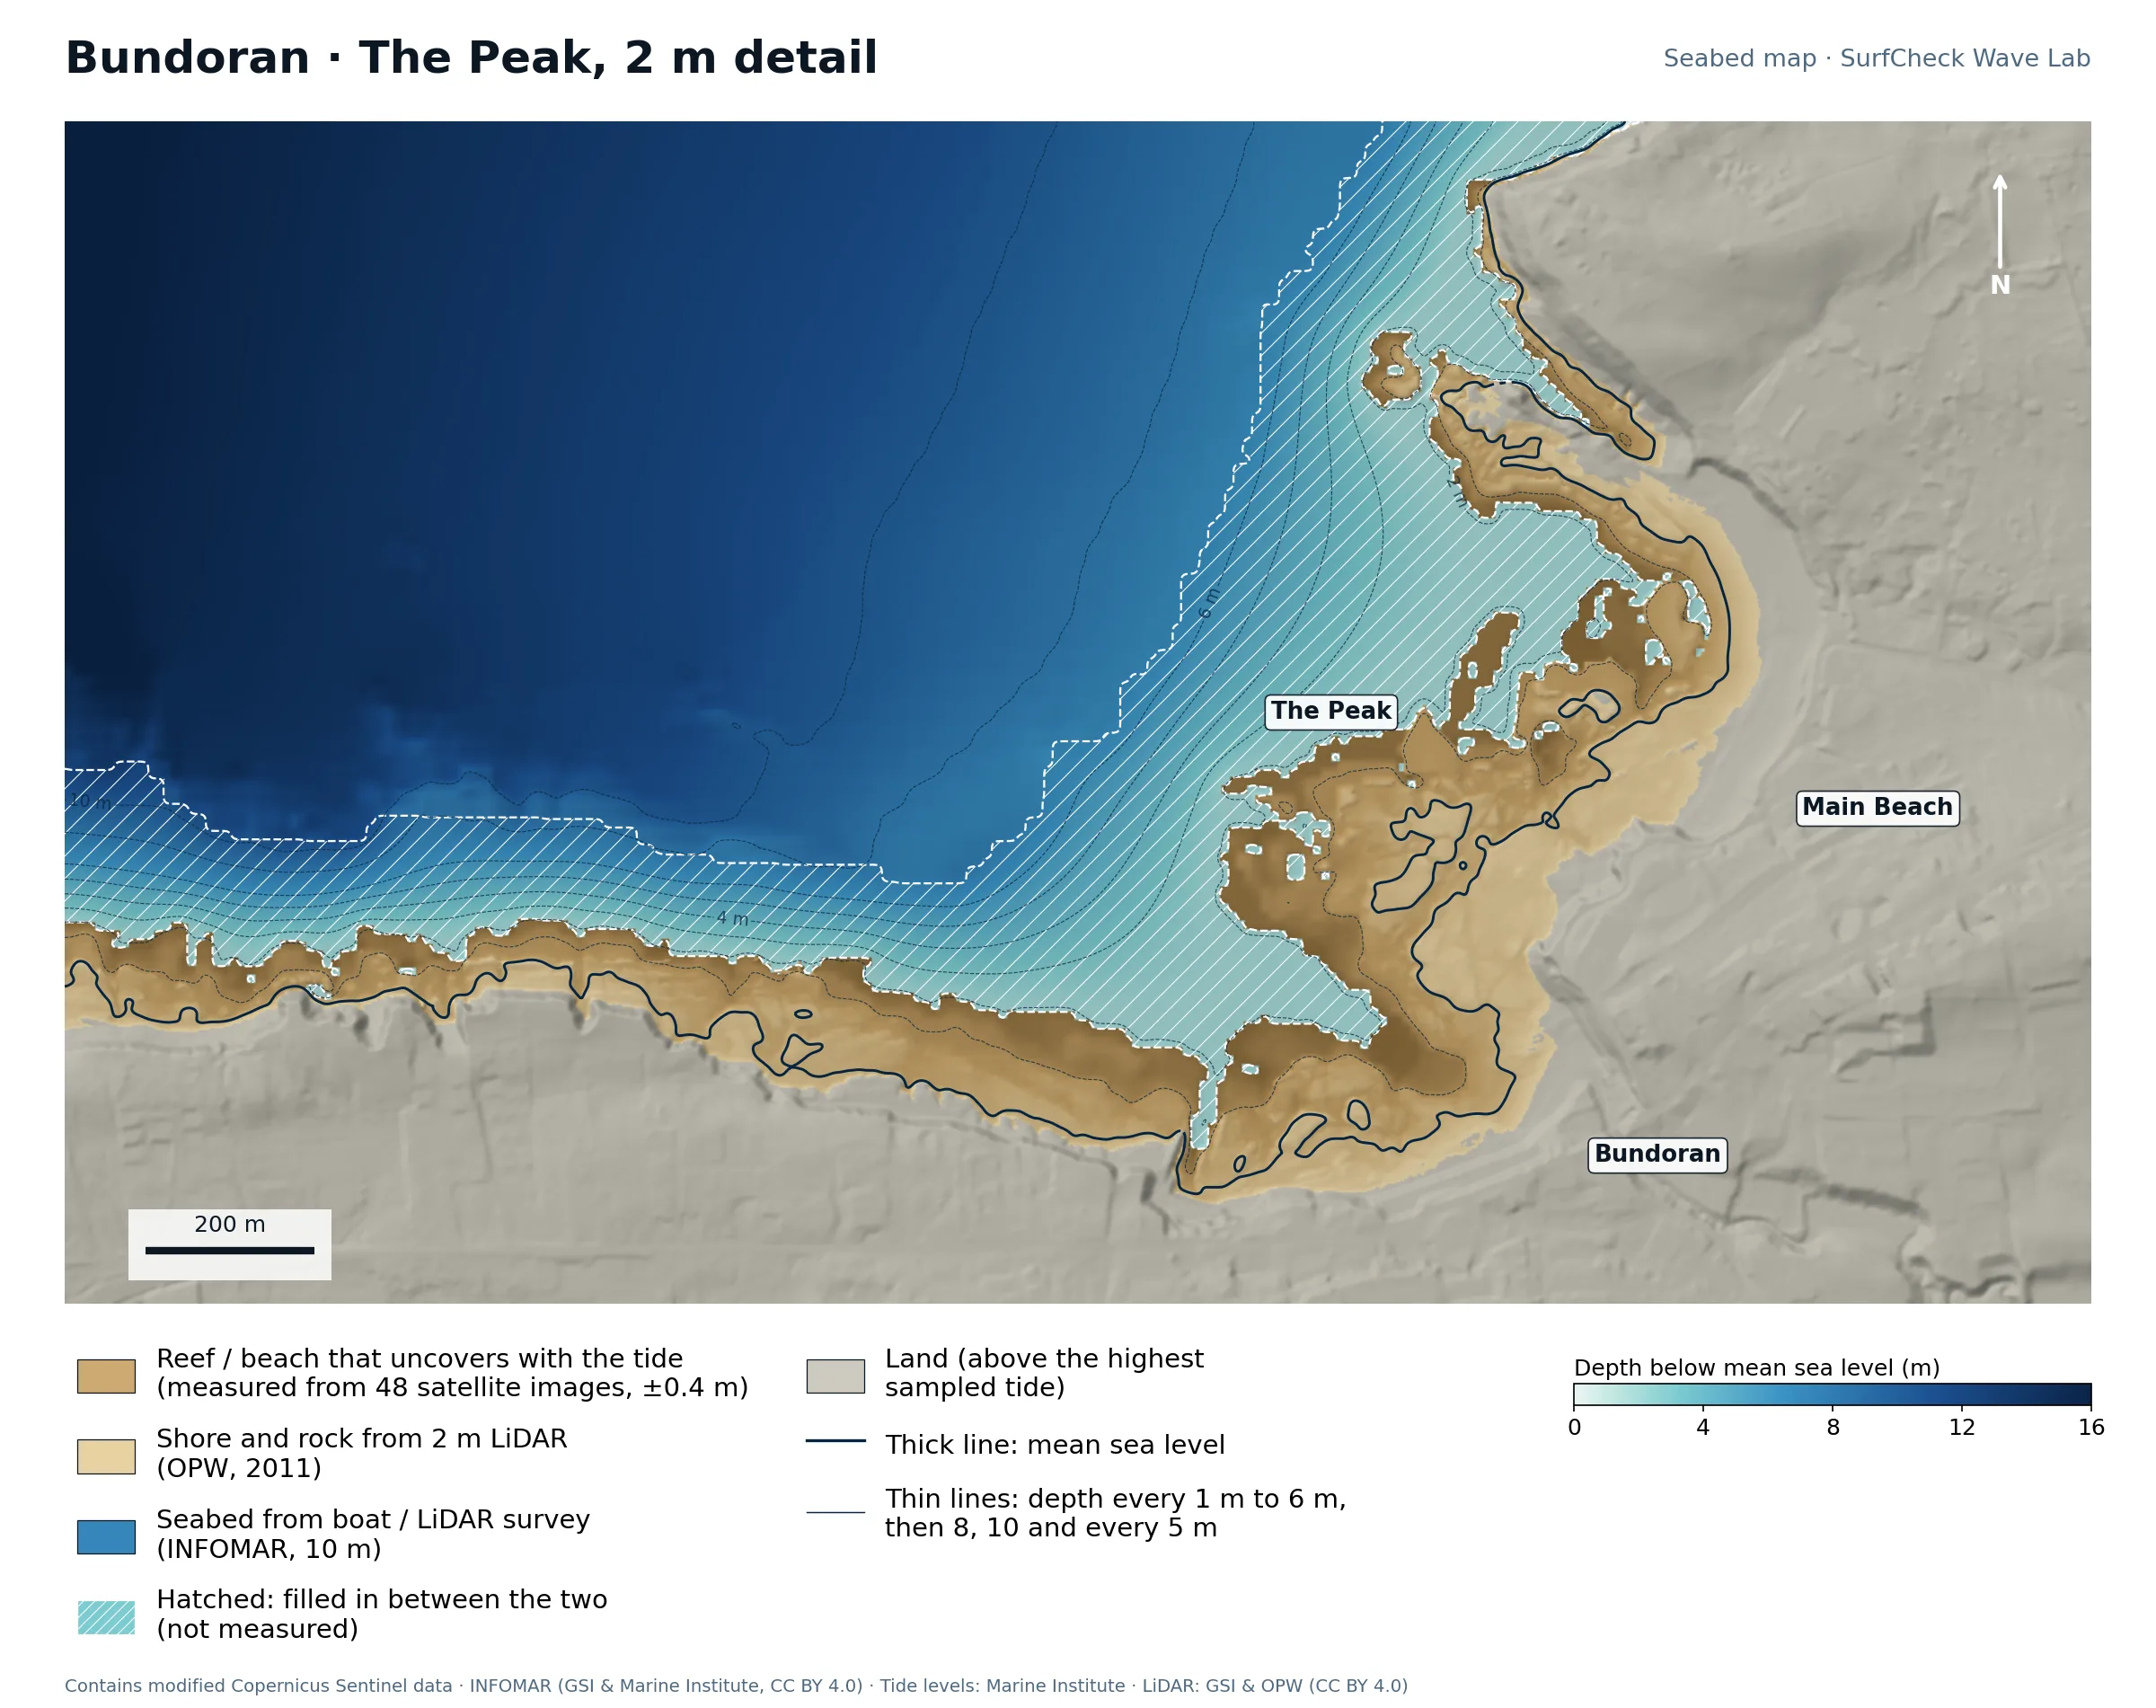
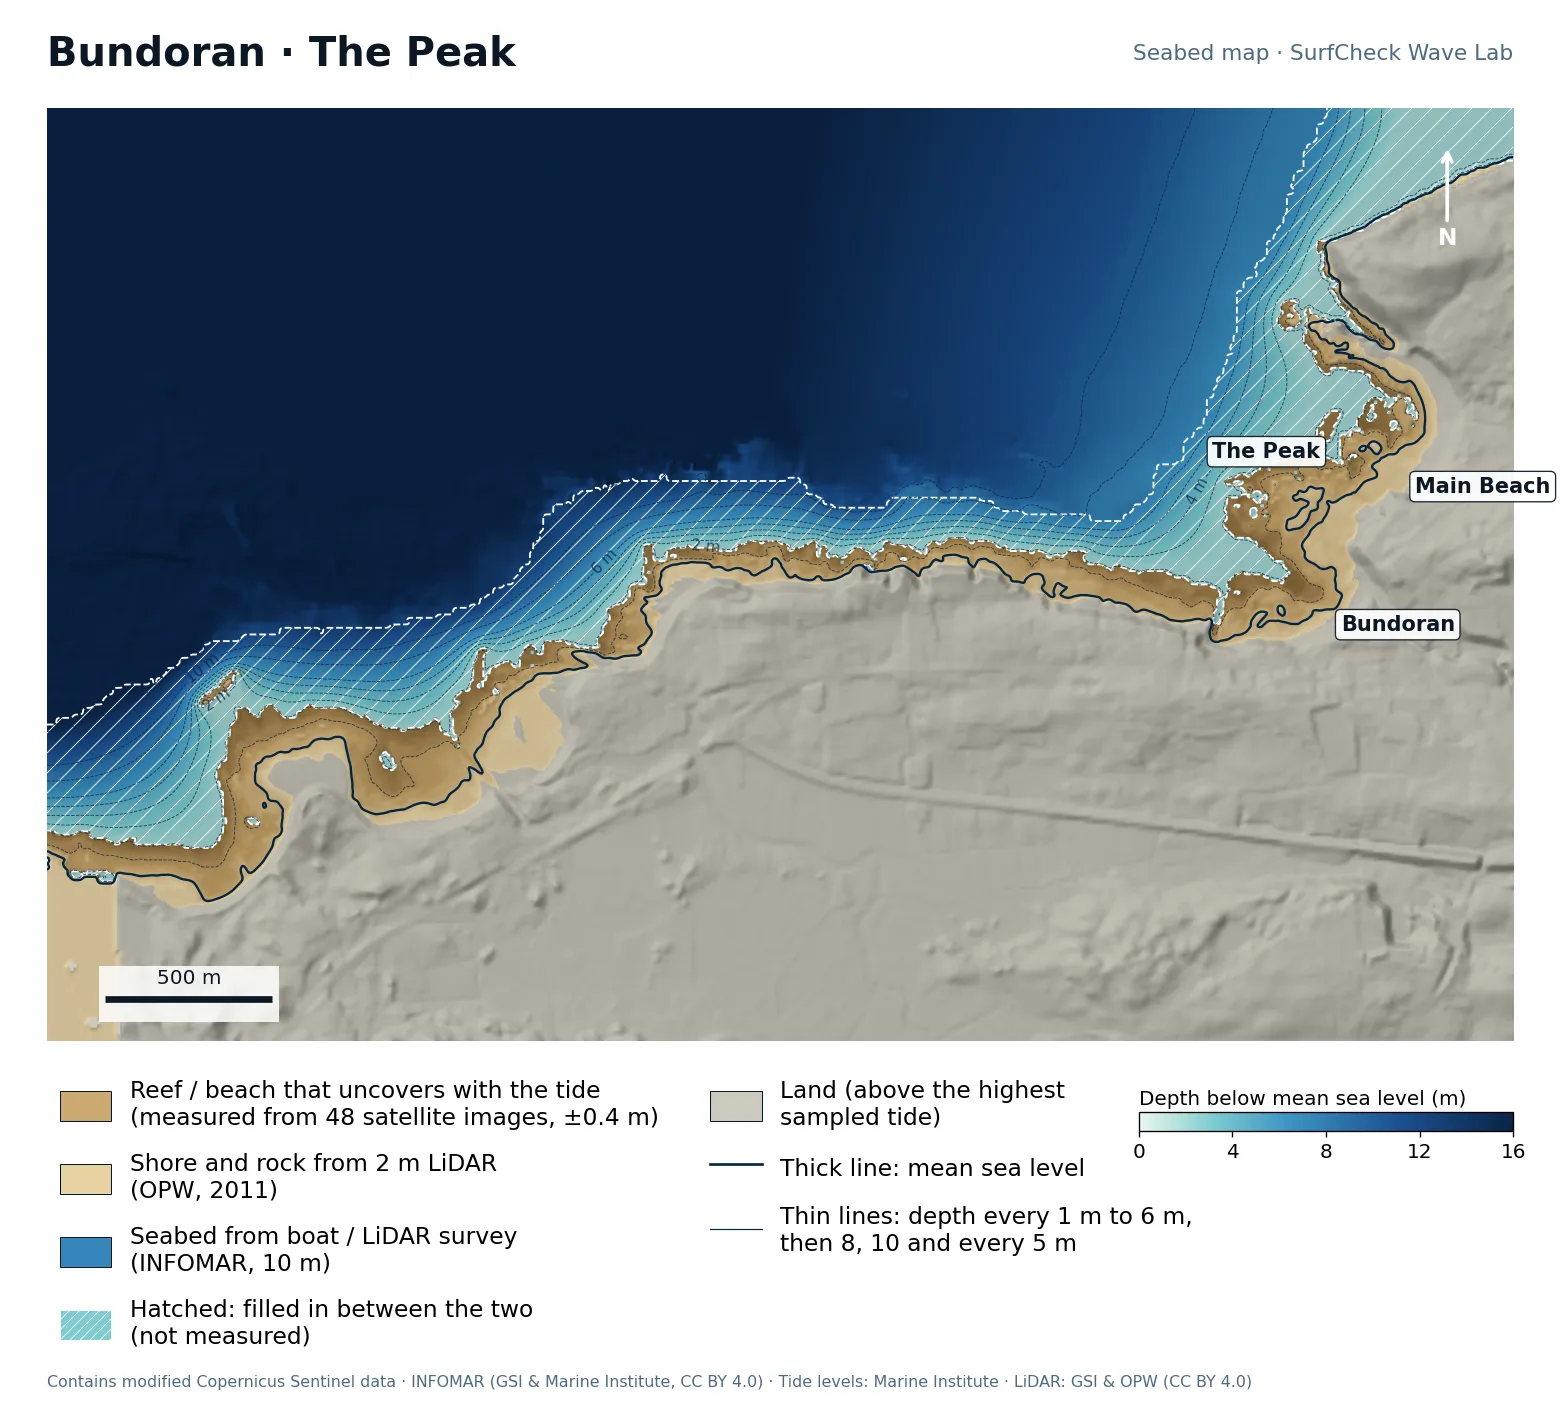
Bundoran · The Peak
Well measured
Seabed map of Bundoran · The Peak: depth contours, the reef or beach that uncovers with the tide, and which parts are measuredClose-up of Bundoran · The Peak in finer detail from LiDAR
81%
of the sea here is measured
101 ha
uncovers with the tide
48
satellite images used
140 m
filled-in band, typical width

What the seabed shows

The Peak is the triangular rock shelf that pushes about 250 m out from the town, just west of the main beach. Its tip is the take-off: swell meets the point of the triangle first and peels down both edges, which is why it breaks left and right. West of it the coast is a ragged rock platform 60 to 150 m wide with no beach at all.

How sure we are

One of the best-measured spots in the atlas. The shore and upper reef come from 2 m LiDAR, the lower reef from 48 satellite images, and the boat survey comes unusually close inshore, so the filled-in band is typically only about 140 m wide.

In the Wave Lab

Low confidence, because the seabed under the break is not measured. Swell direction is too close to call: the model cannot separate directions that differ by less than about 30% in breaker size. Breakers are about 7% bigger at high tide than at low.
Forecast and tides See it in 3D Run it in the Wave Lab

Co. Sligo · Beach break with shifting bars

Strandhill

Well measured
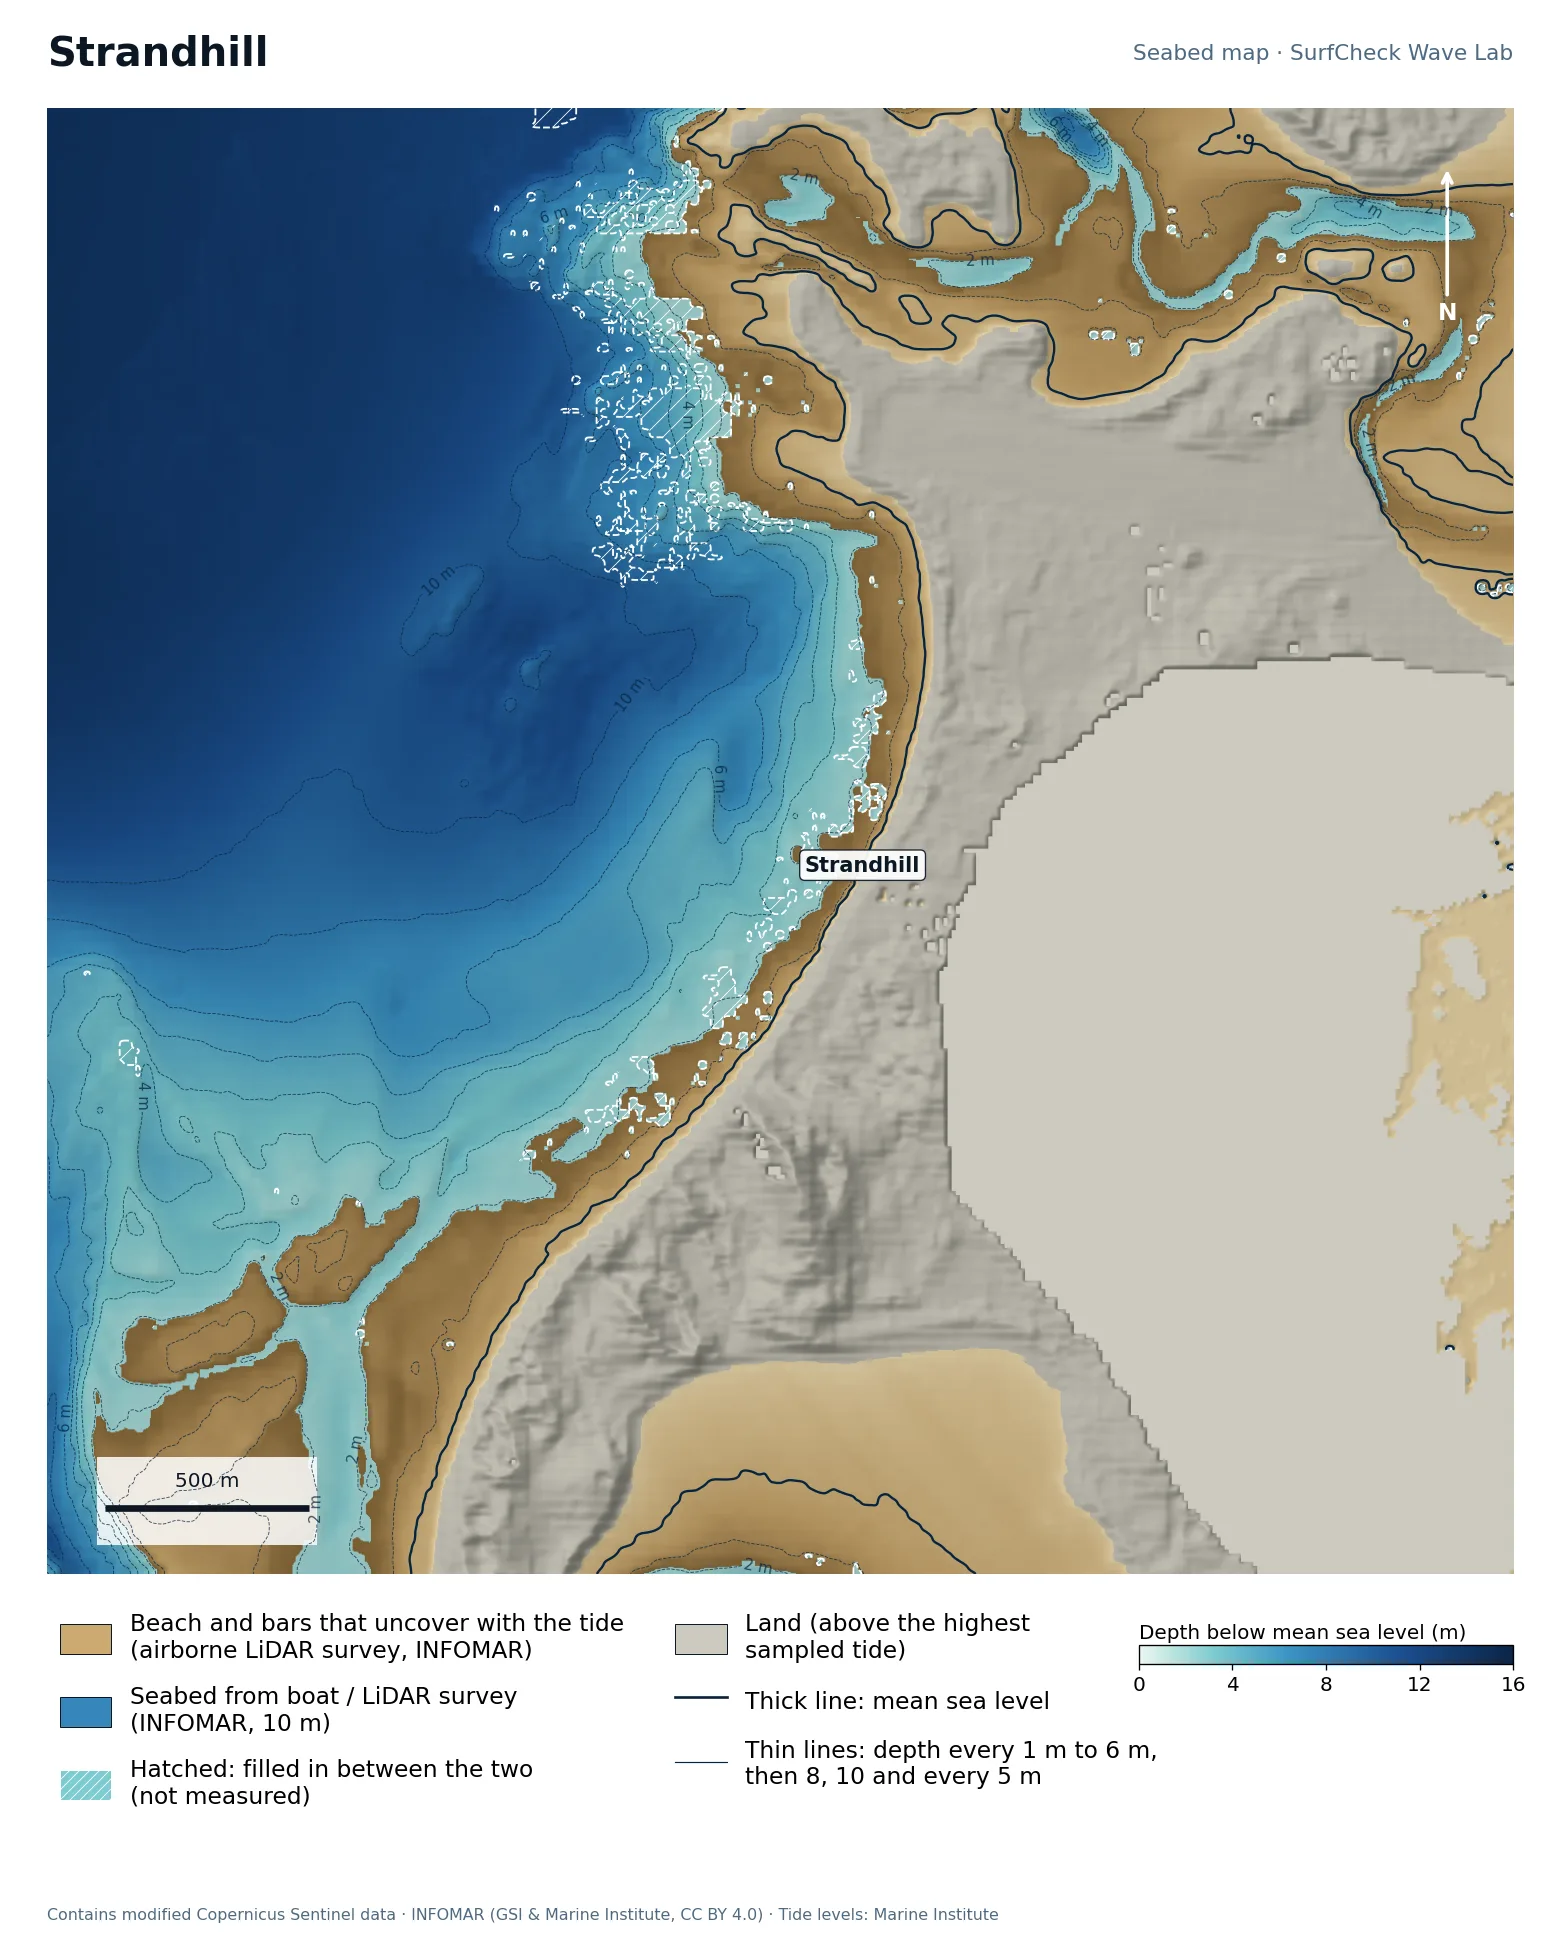
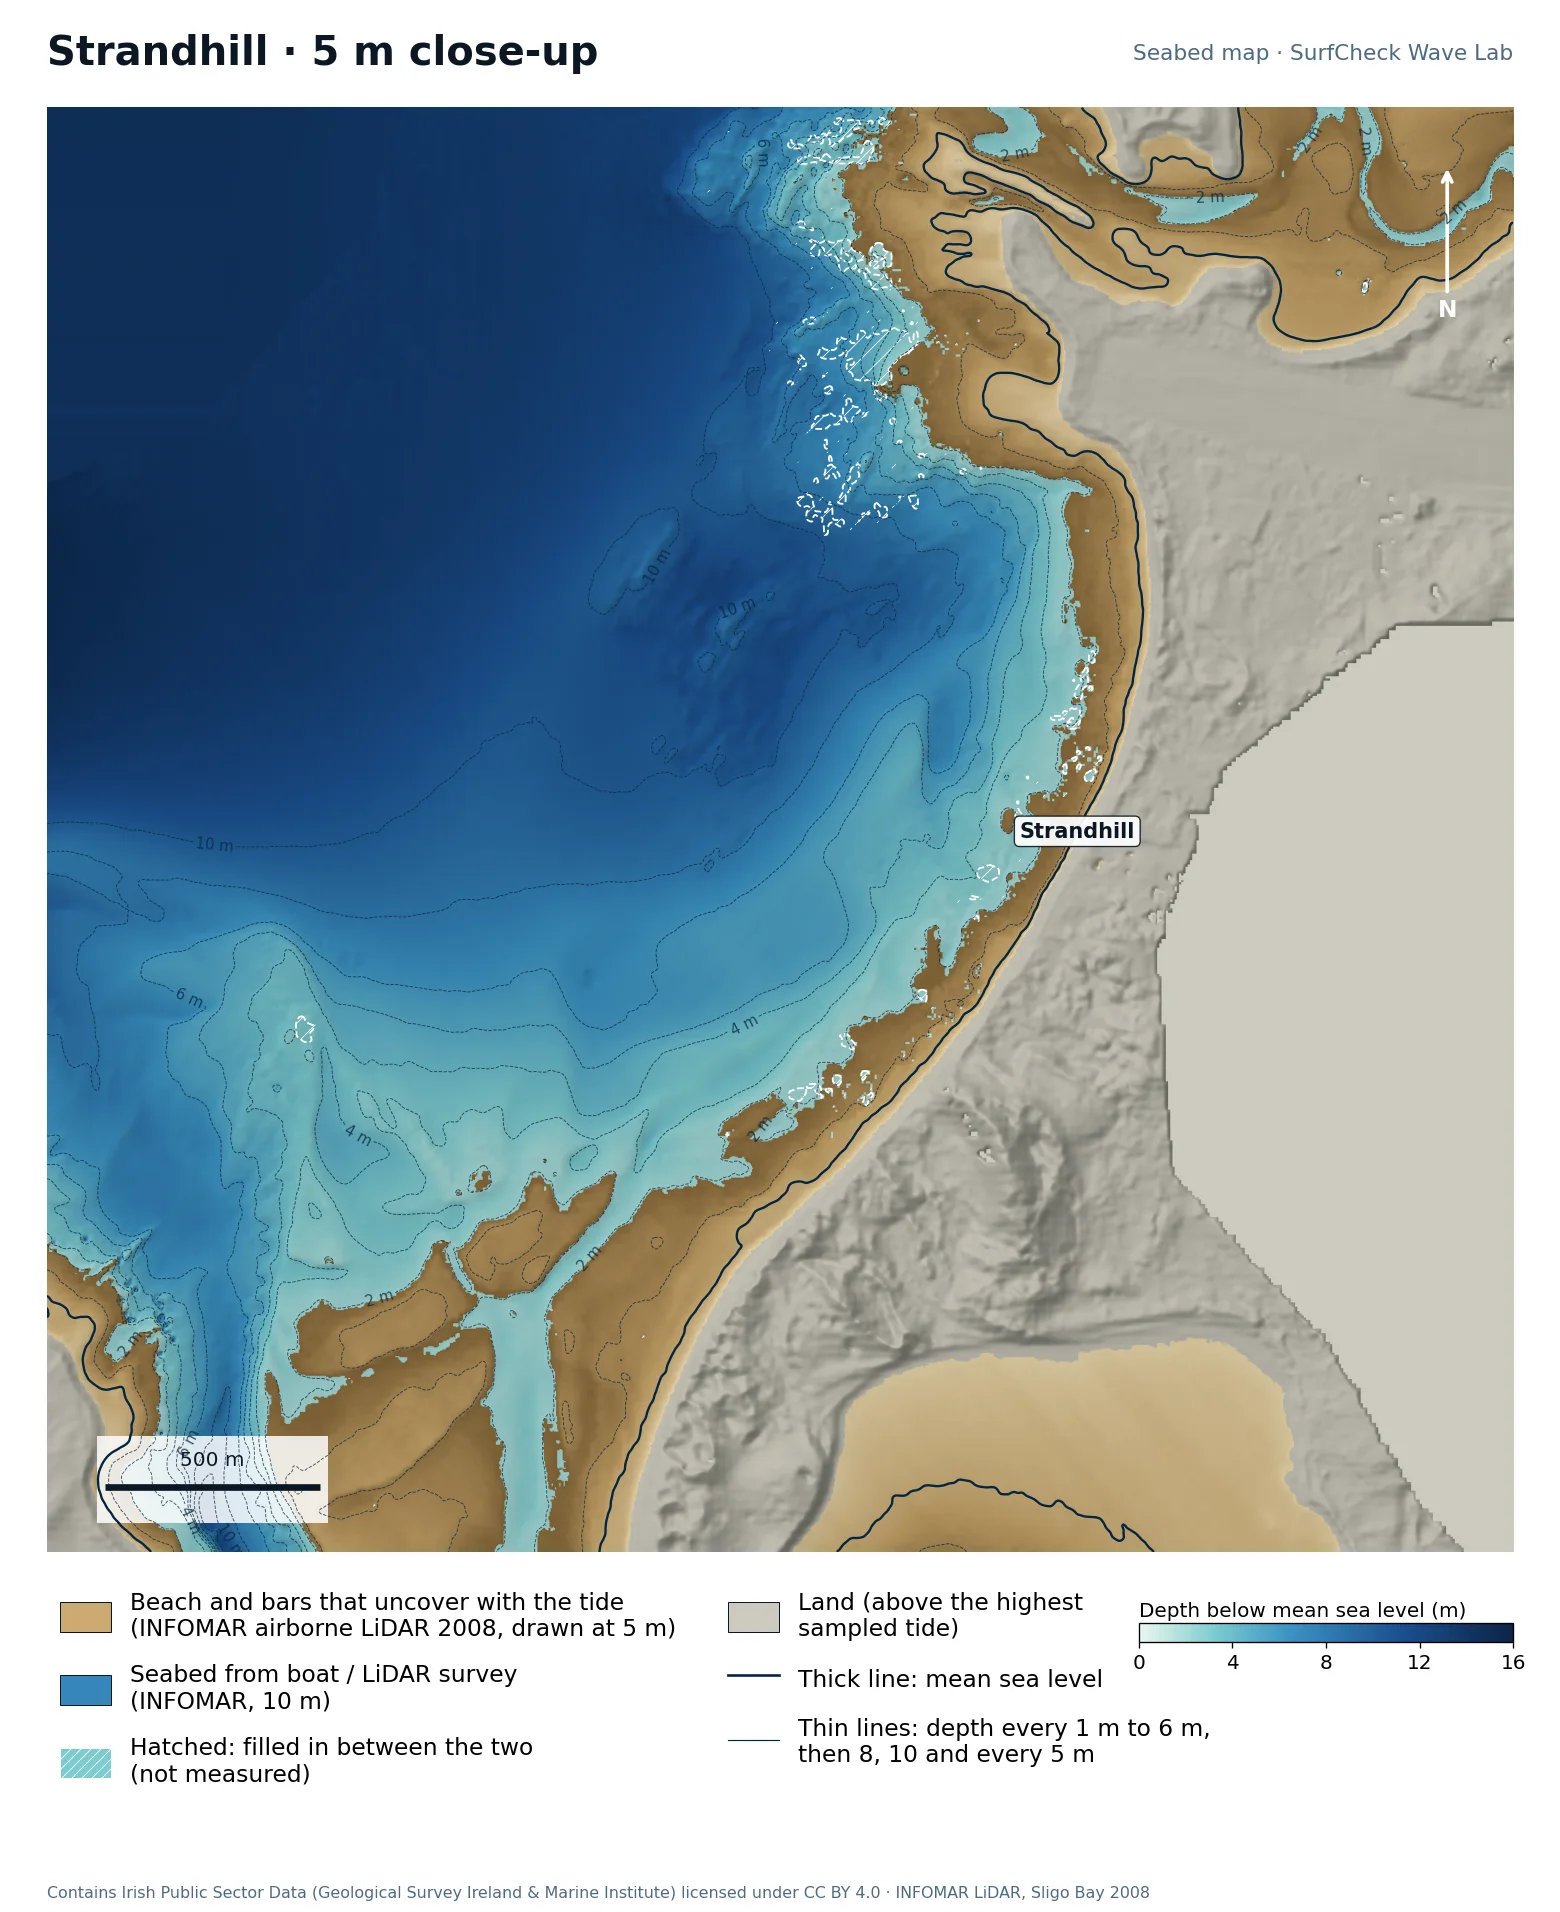
Seabed map of Strandhill: depth contours, the reef or beach that uncovers with the tide, and which parts are measuredClose-up of Strandhill in finer detail from LiDAR
98%
of the sea here is measured
283 ha
uncovers with the tide
42
satellite images used
None
filled-in band, typical width

What the seabed shows

A west-facing beach with a 4 to 6 m shelf to the south-west and deep water, 10 m and more, straight out front. To the north the shore swings into the channel that drains Sligo Harbour past Coney Island, and the sandflats around it dry at low tide. That channel is where the famous rips come from: all the water in the harbour goes in and out past the end of the beach.

How sure we are

Almost fully measured. INFOMAR flew an airborne LiDAR survey here that maps the beach, the bars and the bay floor in one pass, so 98% of the sea in this map is survey data. The bars are as surveyed; real ones move with every storm.

In the Wave Lab

Swell direction is too close to call: the model cannot separate directions that differ by less than about 30% in breaker size. Breakers are about 19% bigger at low tide than at high.

Forecast and tides See it in 3D Run it in the Wave Lab

Co. Sligo · Two reef points: a left and a right

Easkey

Part measured
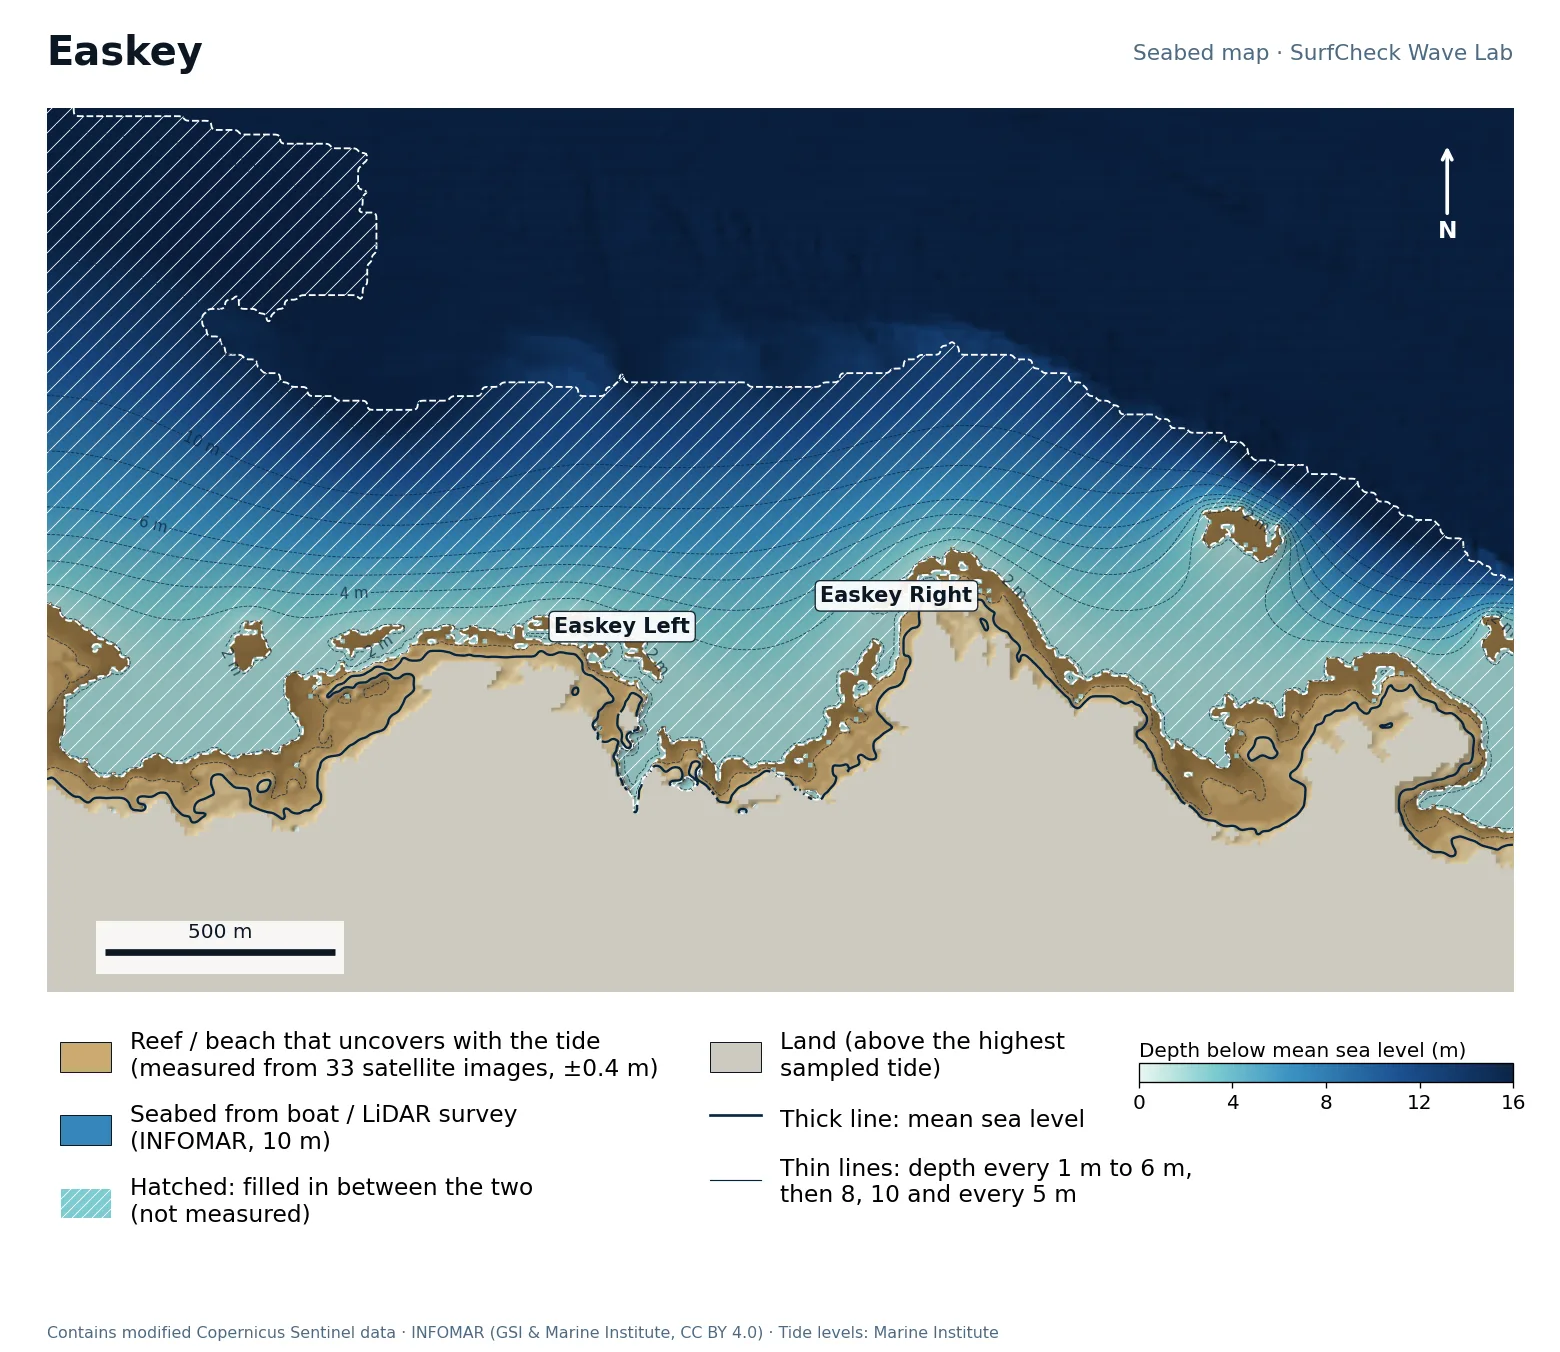
Seabed map of Easkey: depth contours, the reef or beach that uncovers with the tide, and which parts are measured
50%
of the sea here is measured
50 ha
uncovers with the tide
33
satellite images used
240 m
filled-in band, typical width

What the seabed shows

Two rock points about 600 m apart with a bay between them, and a flat rock shelf 80 to 150 m wide wrapping each one. Easkey Left breaks off the western point and Easkey Right off the eastern one by the castle. A separate rock sits about 300 m off the eastern shore. On the old seabed the model called Easkey a close-out; on this one it breaks as two separate waves off the two points.

How sure we are

Half measured. The shelves are mapped from 33 satellite images, but the boat survey stops in 11 to 16 m of water, leaving a filled-in band typically about 240 m wide: the widest of the Sligo reefs.

In the Wave Lab

Low confidence, because the seabed under the break is not measured. Swell direction is too close to call: the model cannot separate directions that differ by less than about 30% in breaker size. Breakers are about 6% bigger at low tide than at high.

Forecast and tides See it in 3D Run it in the Wave Lab

Co. Sligo · Big-wave reef

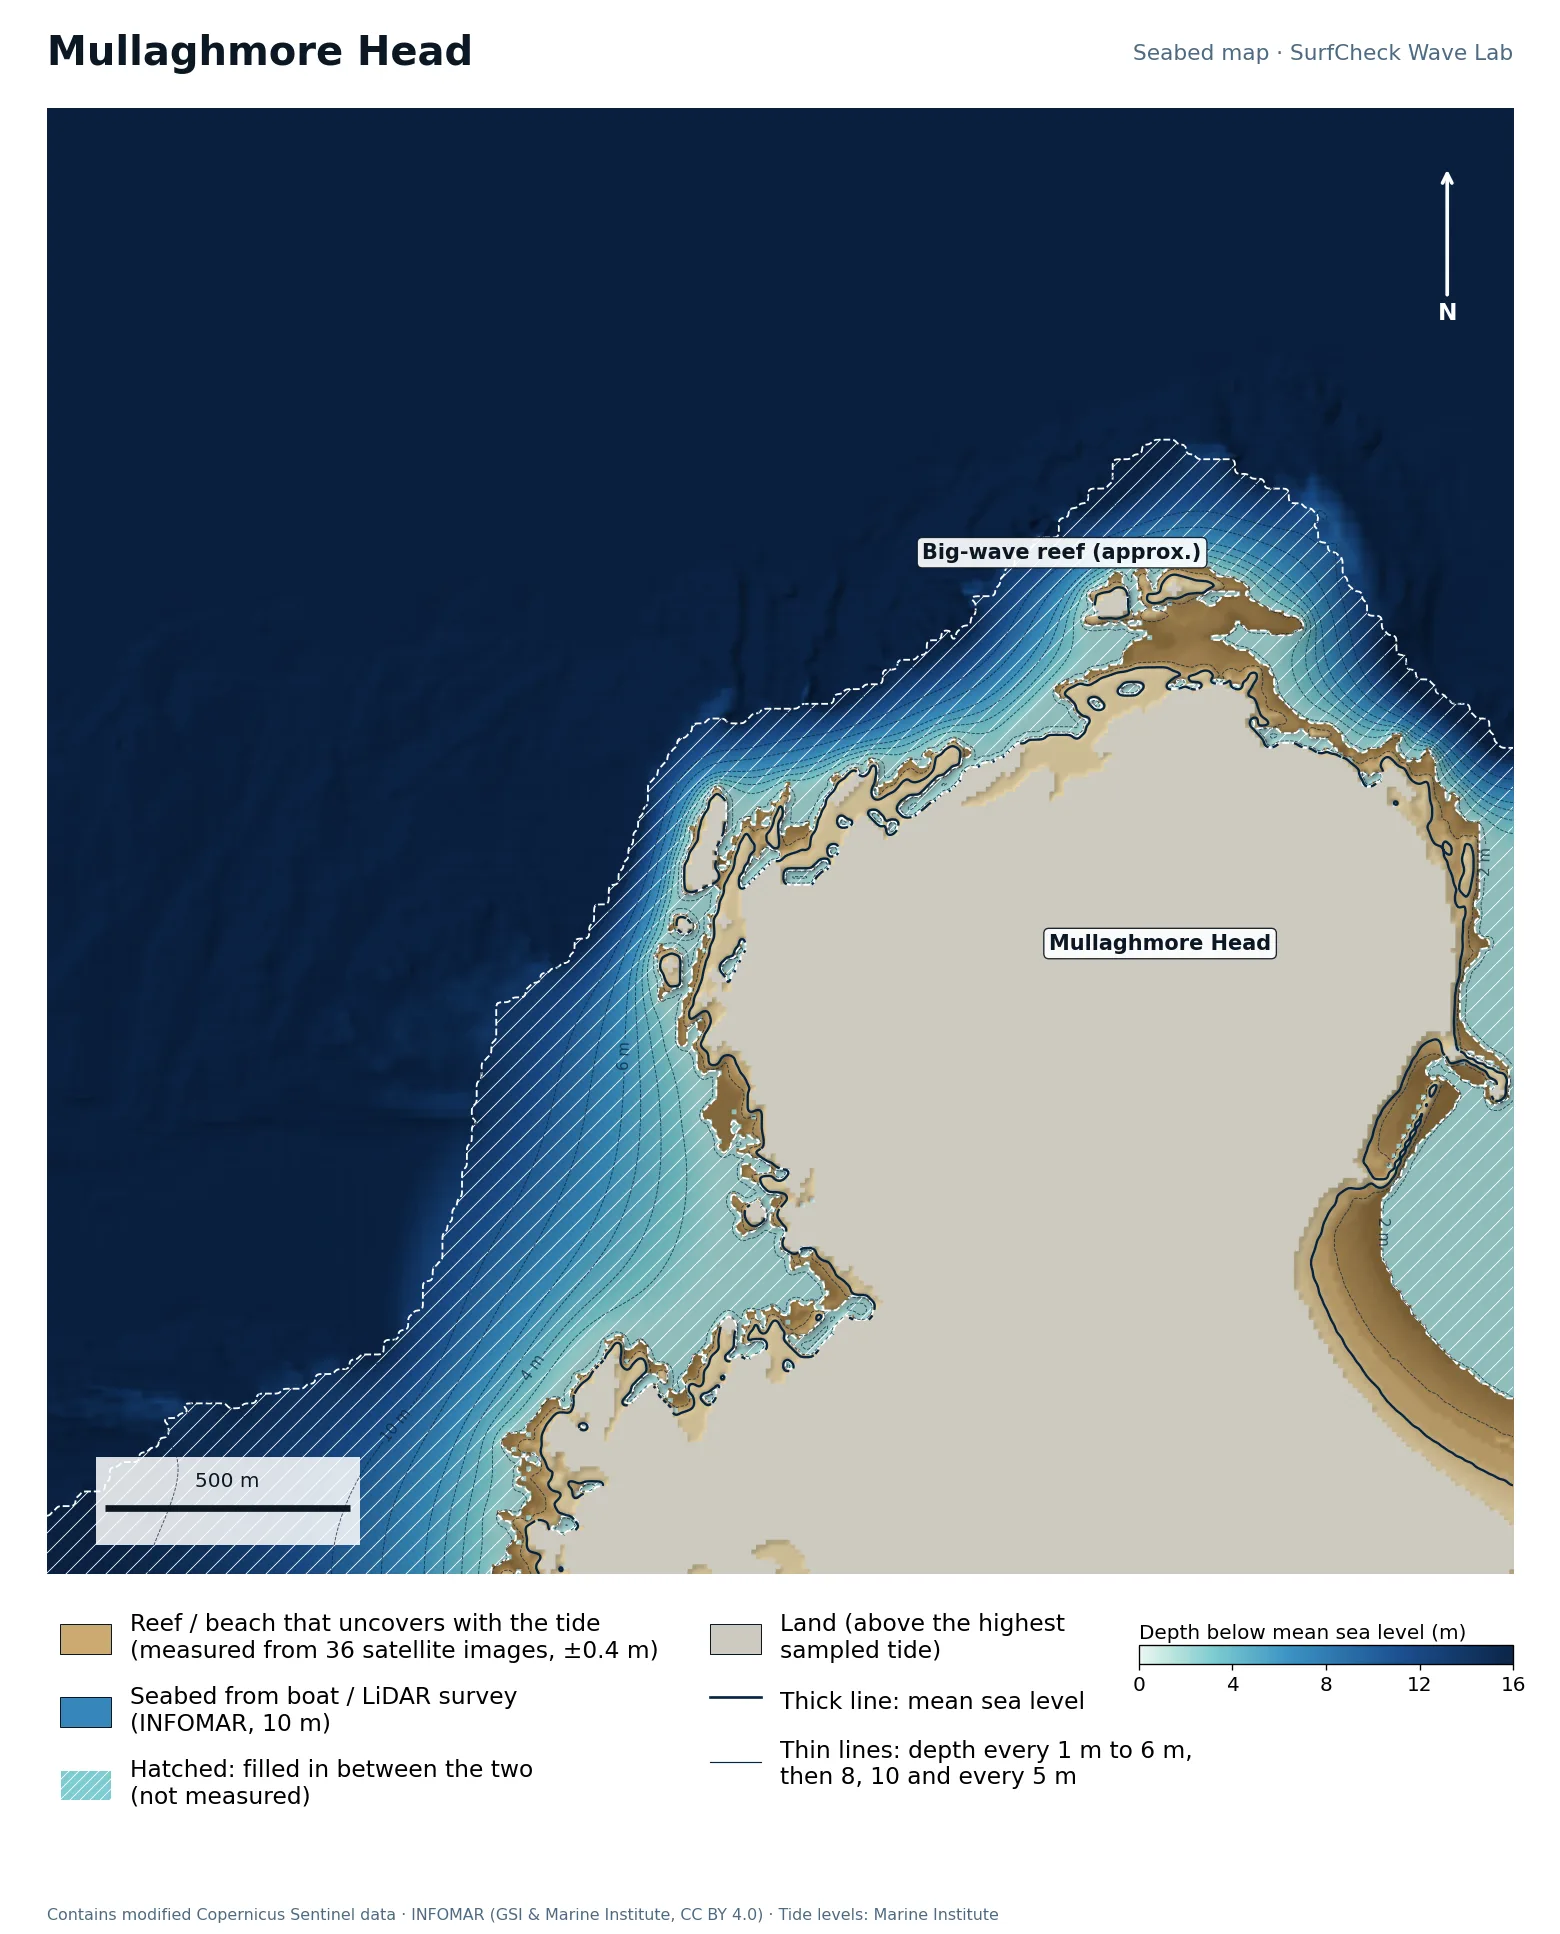
Mullaghmore Head

Well measured
Seabed map of Mullaghmore Head: depth contours, the reef or beach that uncovers with the tide, and which parts are measured
78%
of the sea here is measured
51 ha
uncovers with the tide
36
satellite images used
130 m
filled-in band, typical width

What the seabed shows

The steepest approach in the atlas. Fifteen metres of water lies within about 200 m of the north-west tip, and the rock shelf round the Head is only 30 to 100 m wide, with a scatter of skerries off the tip. Swell arrives almost untouched by the seabed and meets the rock all at once, which is the recipe for a heavy wave. The curved beach on the sheltered east side is the harbour strand.

How sure we are

The shelf and skerries are mapped from 36 satellite images and the deep water is survey data. The band between them is narrow, typically about 130 m, but it is exactly where the big wave breaks, so the slab itself is still not measured.

In the Wave Lab

Low confidence, because the seabed under the break is not measured. Swell direction is too close to call: the model cannot separate directions that differ by less than about 30% in breaker size. Tide changes breaker size by under 4%.

Forecast and tides See it in 3D Run it in the Wave Lab

Co. Sligo · Flat-rock reef, lefts and rights

Lislary

Part measured
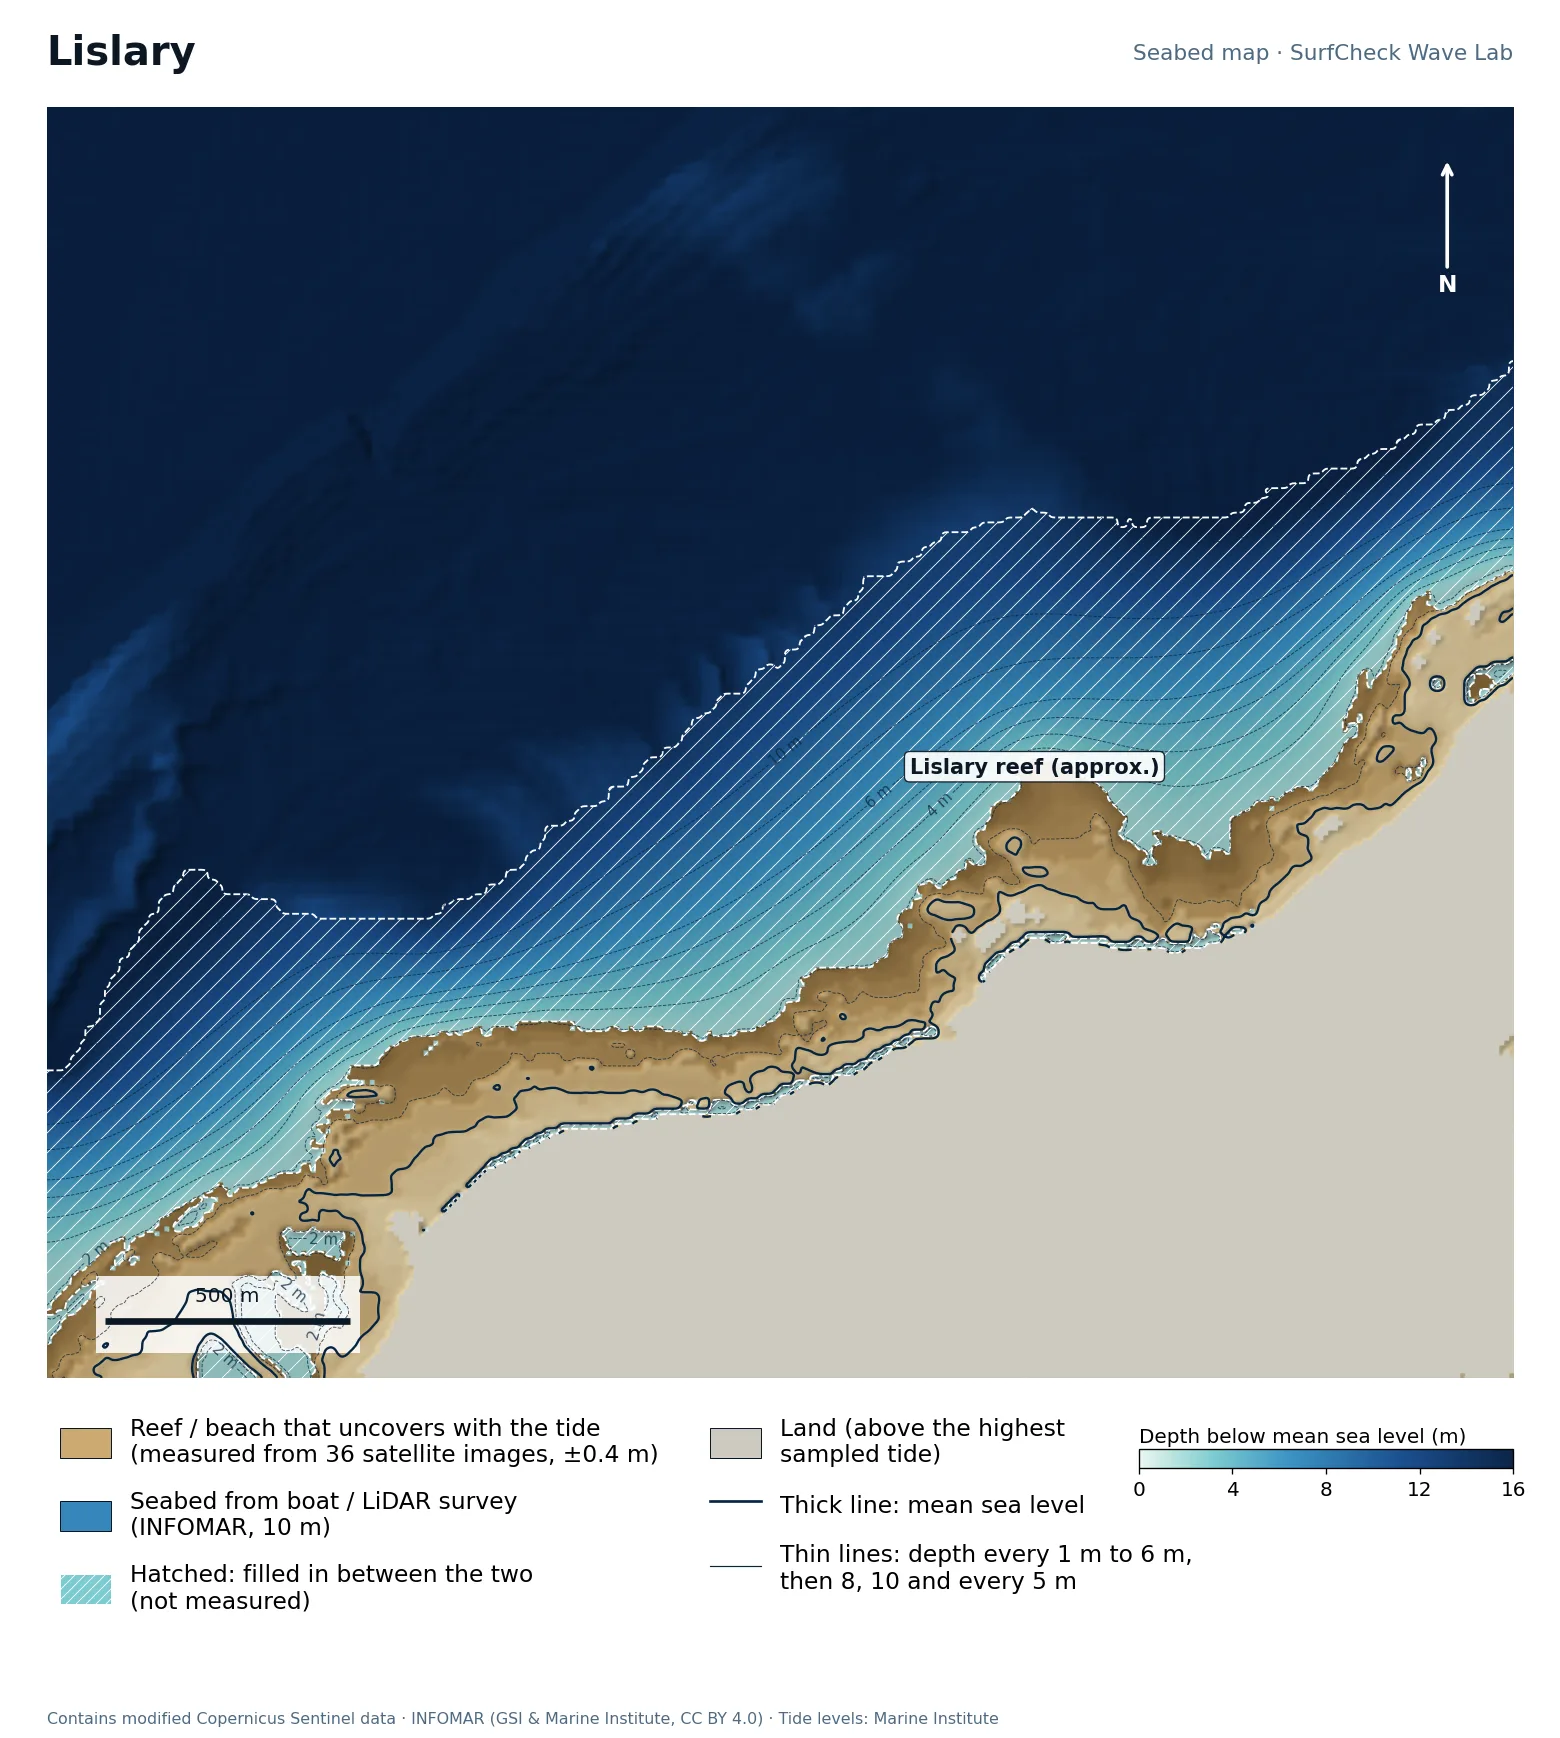
Seabed map of Lislary: depth contours, the reef or beach that uncovers with the tide, and which parts are measured
72%
of the sea here is measured
79 ha
uncovers with the tide
36
satellite images used
190 m
filled-in band, typical width

What the seabed shows

A long, nearly straight rock shelf facing north-north-west, 150 to 250 m wide, that steps down in terraces: you can see the bands in the map. Small bays and points along its seaward edge are what turn an even swell into separate lefts and rights.

How sure we are

The shelf is mapped from 36 satellite images and it is wide, so at higher tides waves break on measured rock. The survey starts in about 14 m, leaving a filled-in band typically around 190 m wide.

In the Wave Lab

Low confidence, because the seabed under the break is not measured. Swell direction is too close to call: the model cannot separate directions that differ by less than about 30% in breaker size. Tide changes breaker size by under 4%.

Forecast and tides See it in 3D Run it in the Wave Lab

Co. Donegal · Open beach break

Tullan Strand

Part measured
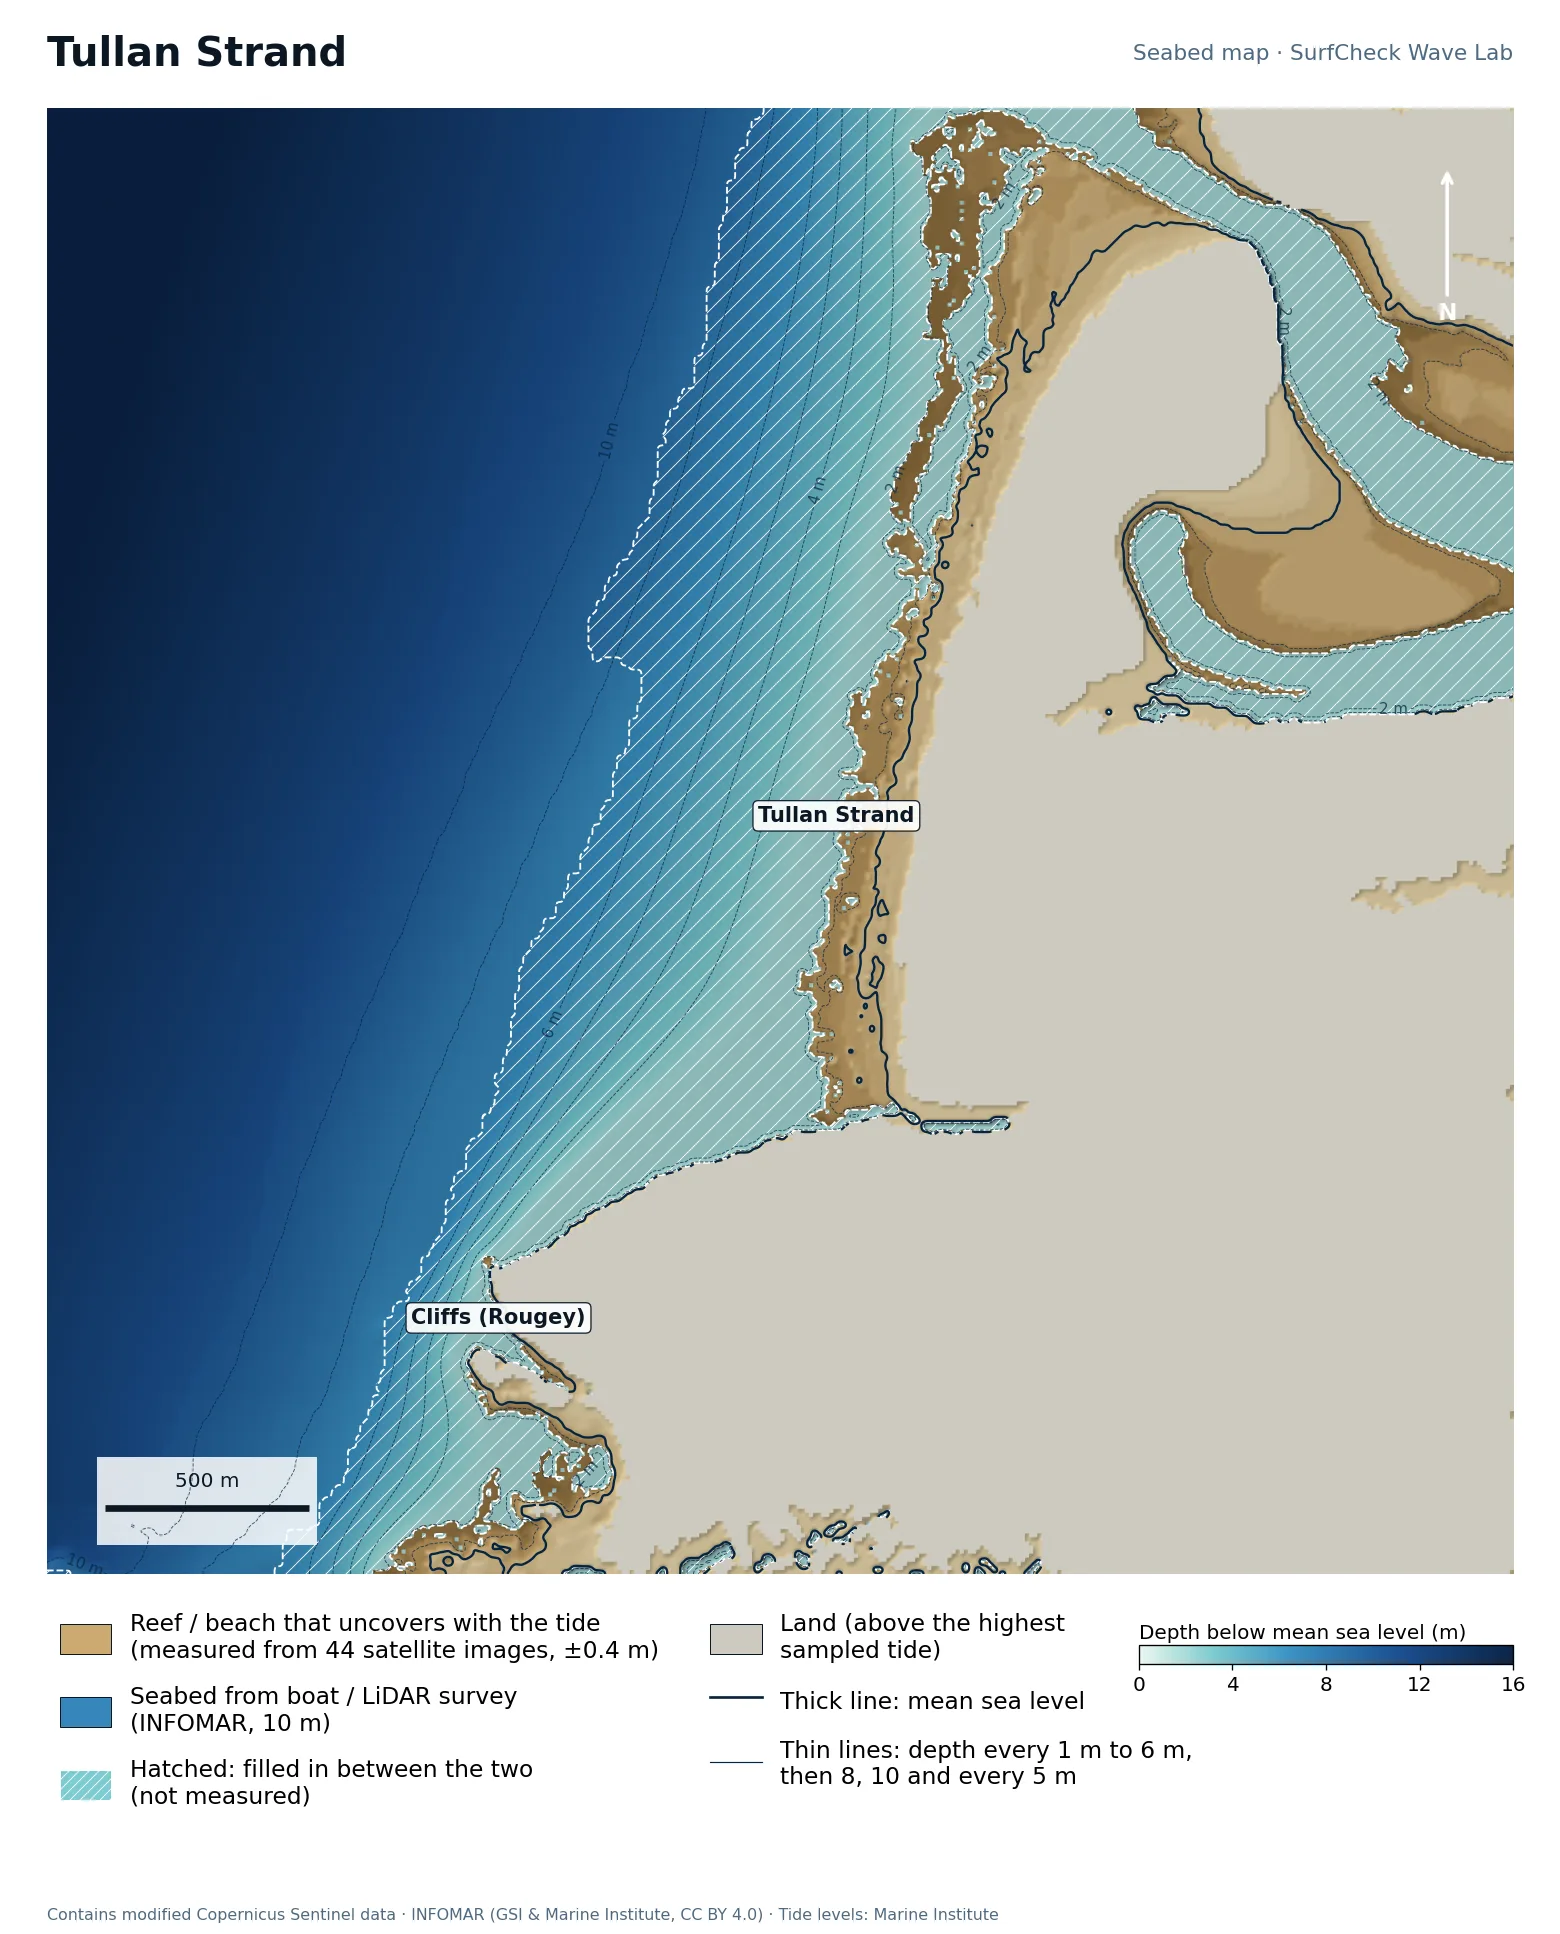
Seabed map of Tullan Strand: depth contours, the reef or beach that uncovers with the tide, and which parts are measured
69%
of the sea here is measured
129 ha
uncovers with the tide
44
satellite images used
140 m
filled-in band, typical width

What the seabed shows

Two kilometres of sand between the cliffs at Rougey in the south and the mouth of the Erne estuary in the north. The beach is wide and flat: about 200 m of sand uncovers between high and low water. Outside it the seabed drops evenly to 10 m with no reefs, so the peaks here come from sandbars. The river channel at the north end is a permanent rip.

How sure we are

The beach is mapped from 44 satellite images, averaged over 2018 to 2024, and the survey starts in about 7 m. The band between is where today's sandbars are, and no survey can keep up with those.

In the Wave Lab

Low confidence, because the seabed under the break is not measured. Swell direction is too close to call: the model cannot separate directions that differ by less than about 30% in breaker size. Breakers are about 15% bigger at high tide than at low.

Forecast and tides See it in 3D Run it in the Wave Lab

Co. Sligo · Right-hand cobble reef by the pier

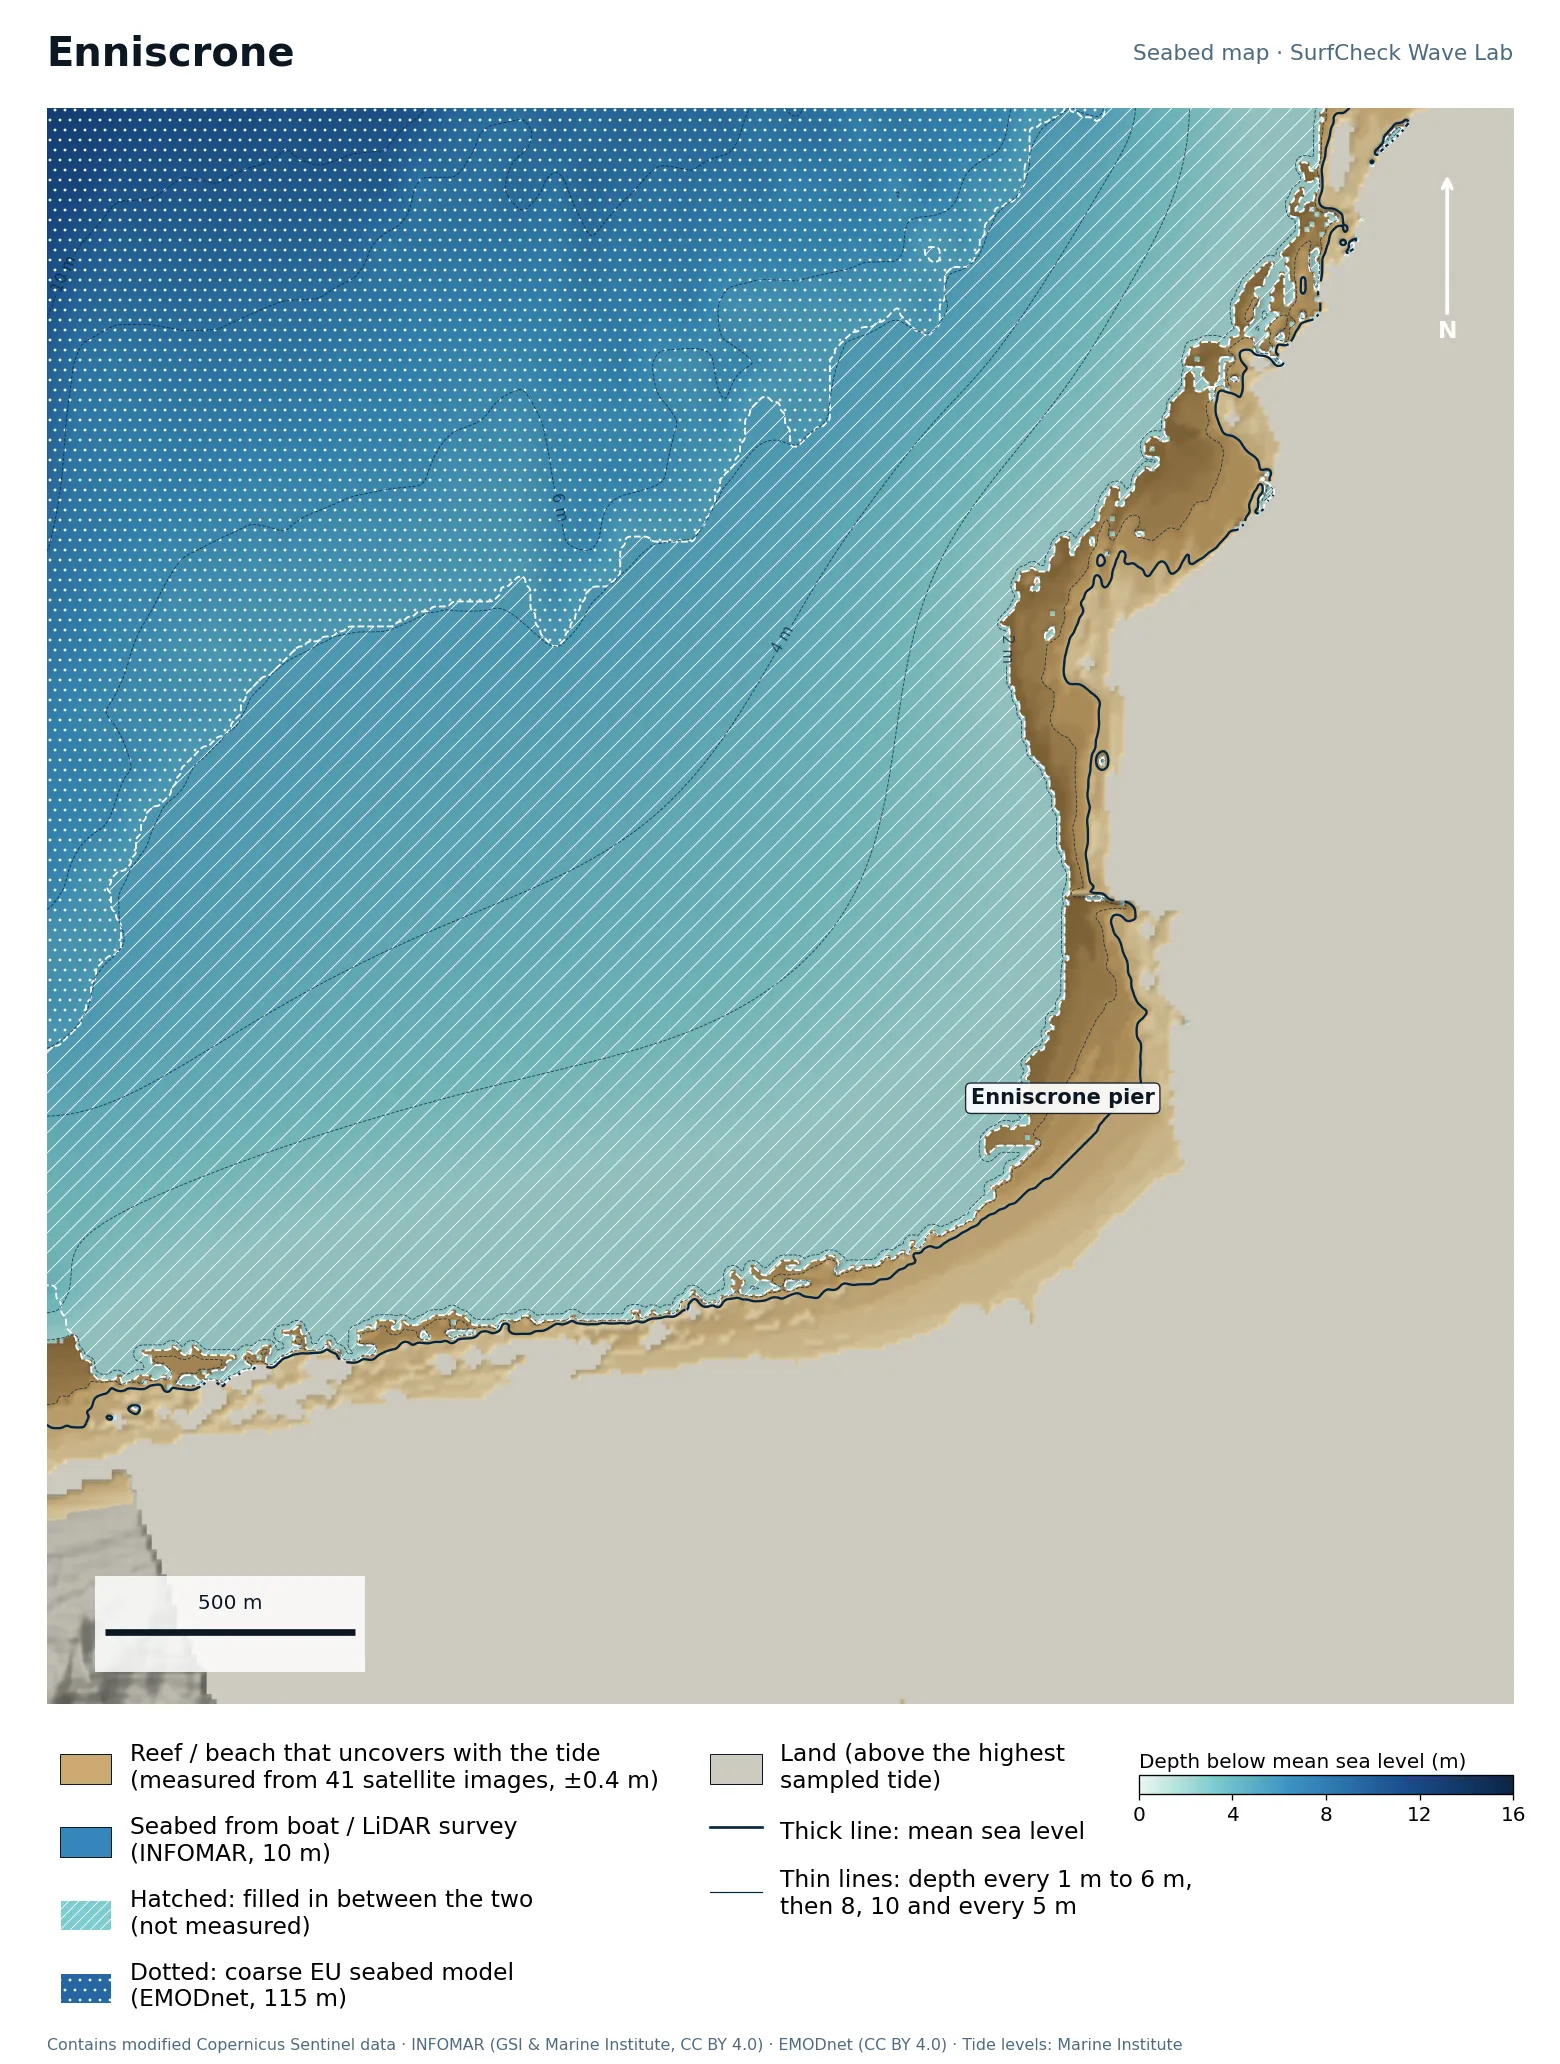
Enniscrone

Shore only
Seabed map of Enniscrone: depth contours, the reef or beach that uncovers with the tide, and which parts are measured
12%
of the sea here is measured
71 ha
uncovers with the tide
41
satellite images used
420 m
filled-in band, typical width

What the seabed shows

The pier sits where the coast turns from a north-facing rock and cobble shore to the long beach running south. The reef patches west of the pier, visible as separate brown shapes just off the shore, are what the right-hander breaks over at low tide. The bay in front is shallow for a long way out.

How sure we are

Only the shore is measured: 41 satellite images map the cobble reef and beach. There is no detailed survey of this part of Killala Bay, so everything below low water is filled in from the coarse EU seabed model. Treat the wave shape as a sketch.

In the Wave Lab

Low confidence, because the seabed under the break is not measured. Swell direction is too close to call: the model cannot separate directions that differ by less than about 30% in breaker size. Breakers are about 15% bigger at high tide than at low.

Forecast and tides See it in 3D Run it in the Wave Lab

Co. Donegal · Sheltered beach and pier reef

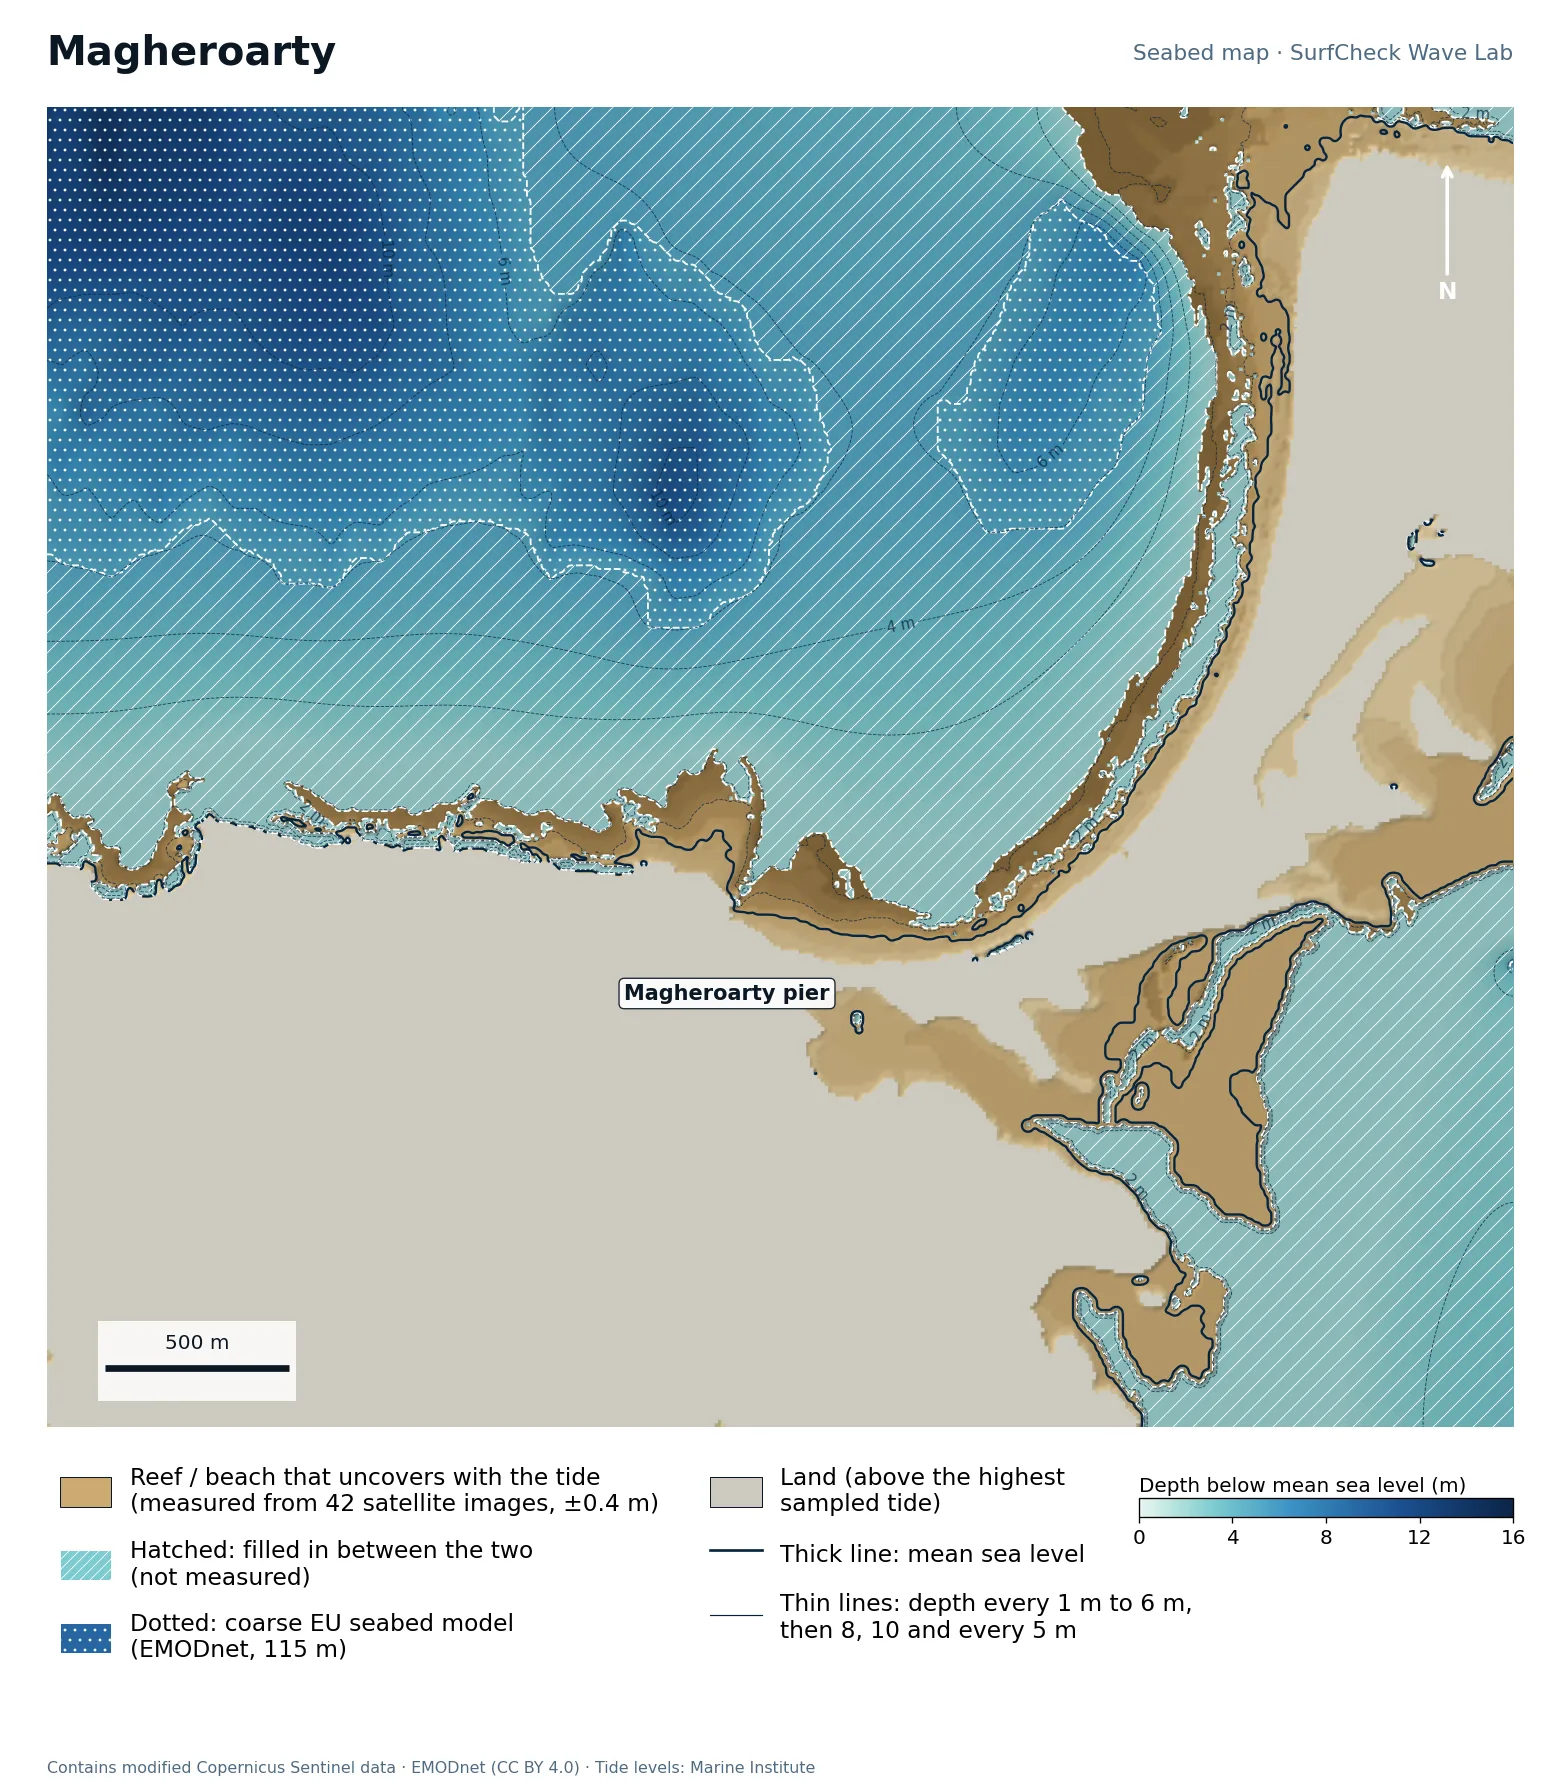
Magheroarty

Shore only
Seabed map of Magheroarty: depth contours, the reef or beach that uncovers with the tide, and which parts are measured
21%
of the sea here is measured
200 ha
uncovers with the tide
42
satellite images used
200 m
filled-in band, typical width

What the seabed shows

A north-west-facing beach in the lee of Inishbofin, with the pier at its western end and a rock shore running west from there. Behind the beach is Ballyness Bay: more than 300 hectares of sandflats and channels that dry out at low tide, all visible at the bottom right. The coarse offshore model shows a deeper hole about a kilometre off the beach.

How sure we are

Only the shore and sandflats are measured, from 42 satellite images. There is no detailed survey offshore, so the seabed below low water is filled in from the coarse EU seabed model.

In the Wave Lab

Low confidence, because the seabed under the break is not measured. Swell direction is too close to call: the model cannot separate directions that differ by less than about 30% in breaker size. Breakers are about 16% bigger at high tide than at low.

Forecast and tides Run it in the Wave Lab

Co. Clare · Beach break with reefs at each end

Lahinch

Part measured
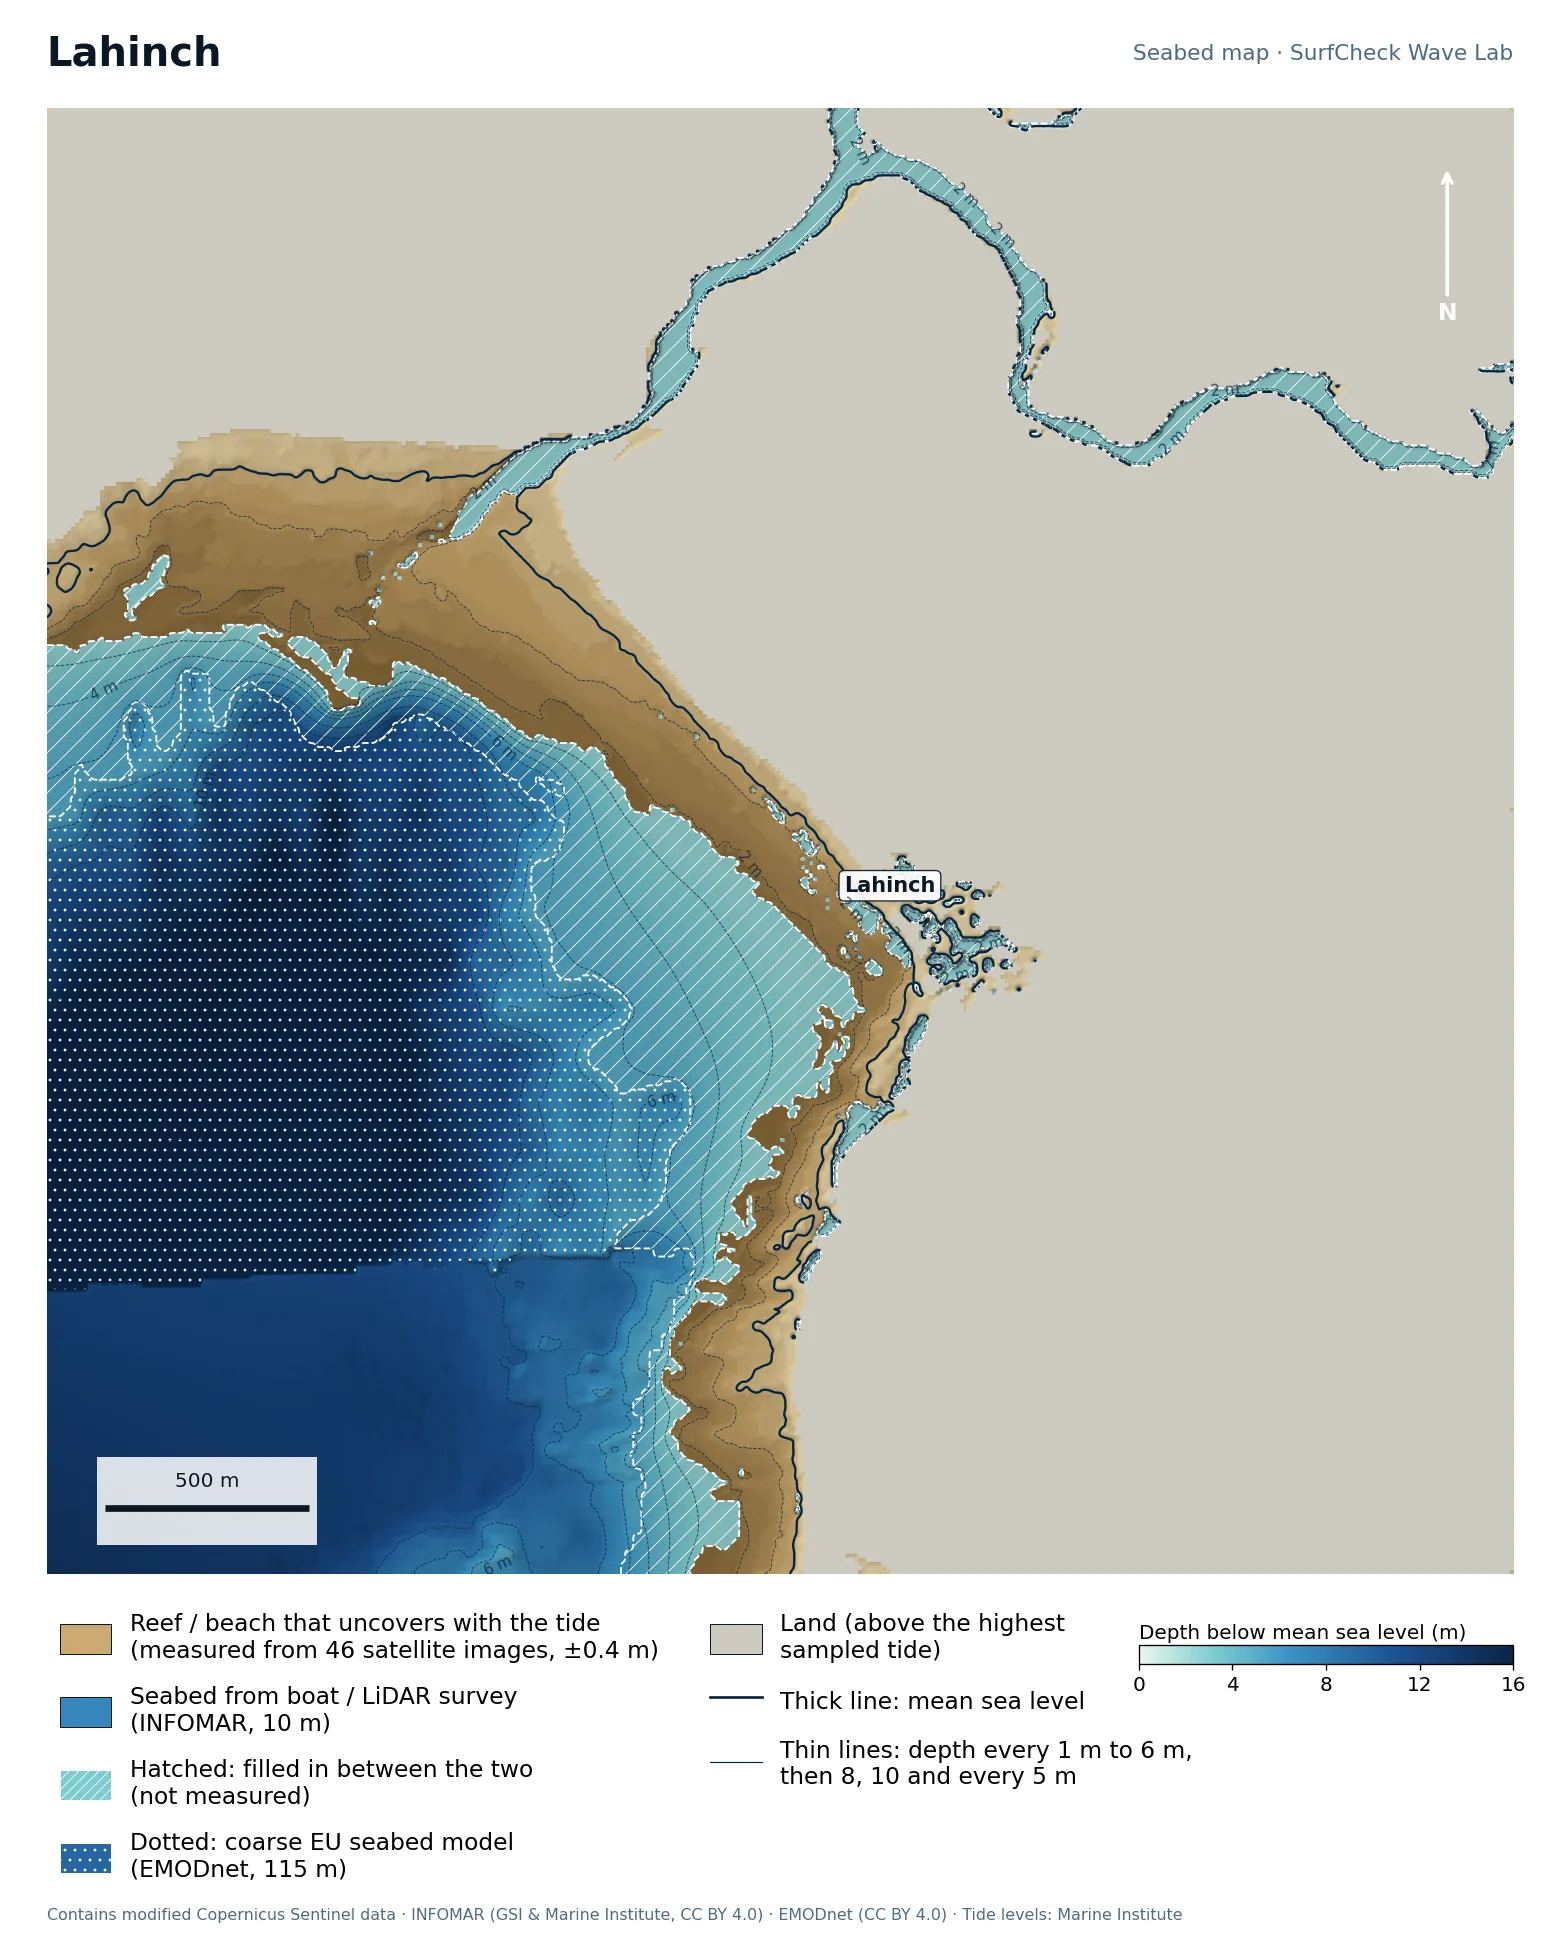
Seabed map of Lahinch: depth contours, the reef or beach that uncovers with the tide, and which parts are measured
46%
of the sea here is measured
130 ha
uncovers with the tide
46
satellite images used
80 m
filled-in band, typical width

What the seabed shows

A west-facing bay about a kilometre and a half across, with a flat sand beach in the middle and rock platforms on both sides. The Inagh river reaches the sea through the dunes at the north end. At high water the sea meets the sea wall and the beach is gone, which is why Lahinch is a low-to-mid-tide spot.

How sure we are

About half measured. The beach and rock platforms are mapped from 46 satellite images, but the detailed survey only covers the outer bay. The middle band is filled in and part of the map falls back to the coarse EU seabed model.

In the Wave Lab

Swell direction is too close to call: the model cannot separate directions that differ by less than about 30% in breaker size. Tide changes breaker size by under 4%.

Forecast and tides See it in 3D Run it in the Wave Lab

Co. Kerry · Long, gentle beach break

Inch Strand

Well measured
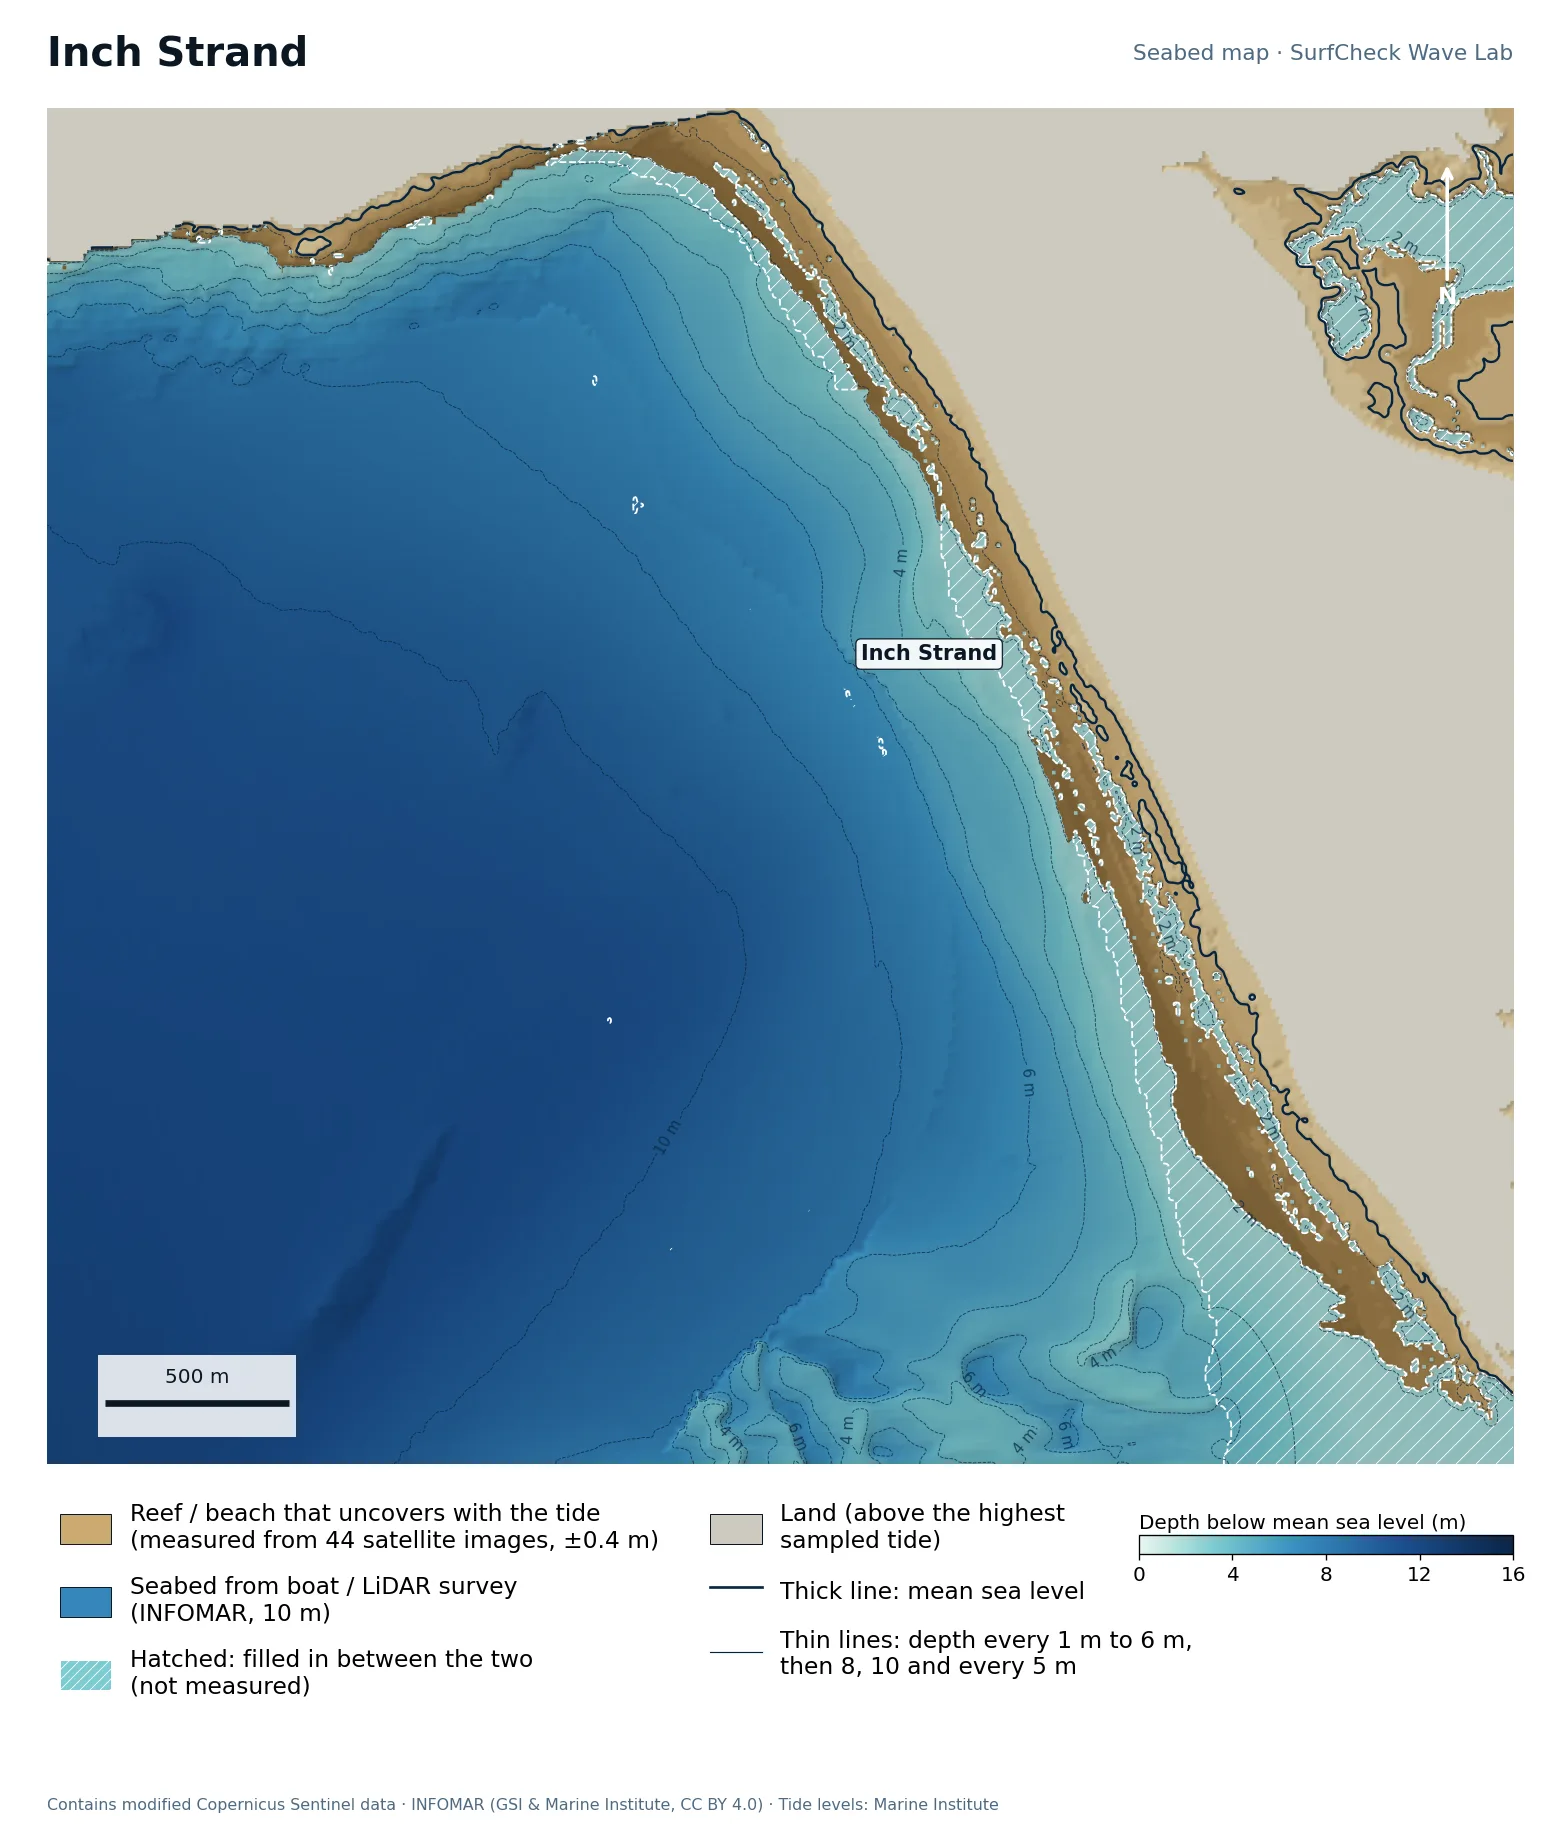
Seabed map of Inch Strand: depth contours, the reef or beach that uncovers with the tide, and which parts are measured
93%
of the sea here is measured
140 ha
uncovers with the tide
44
satellite images used
40 m
filled-in band, typical width

What the seabed shows

A five-kilometre sand spit lying across the head of Dingle Bay. The seabed in front of it is remarkably flat: the 2 m and 4 m contours sit hundreds of metres apart, so waves break far out and roll in slowly. That flatness is why Inch is forgiving, and why it needs a solid swell to break at all.

How sure we are

Almost fully measured. An airborne LiDAR survey maps the bay floor right in to the beach, so 93% of the sea in this map is survey data. Sand moves, so the bars are as surveyed.

In the Wave Lab

Swell direction is too close to call: the model cannot separate directions that differ by less than about 30% in breaker size. Breakers are about 7% bigger at high tide than at low.
Forecast and tides See it in 3D Run it in the Wave Lab

Co. Cork · Two beaches either side of a headland

Inchydoney

Well measured
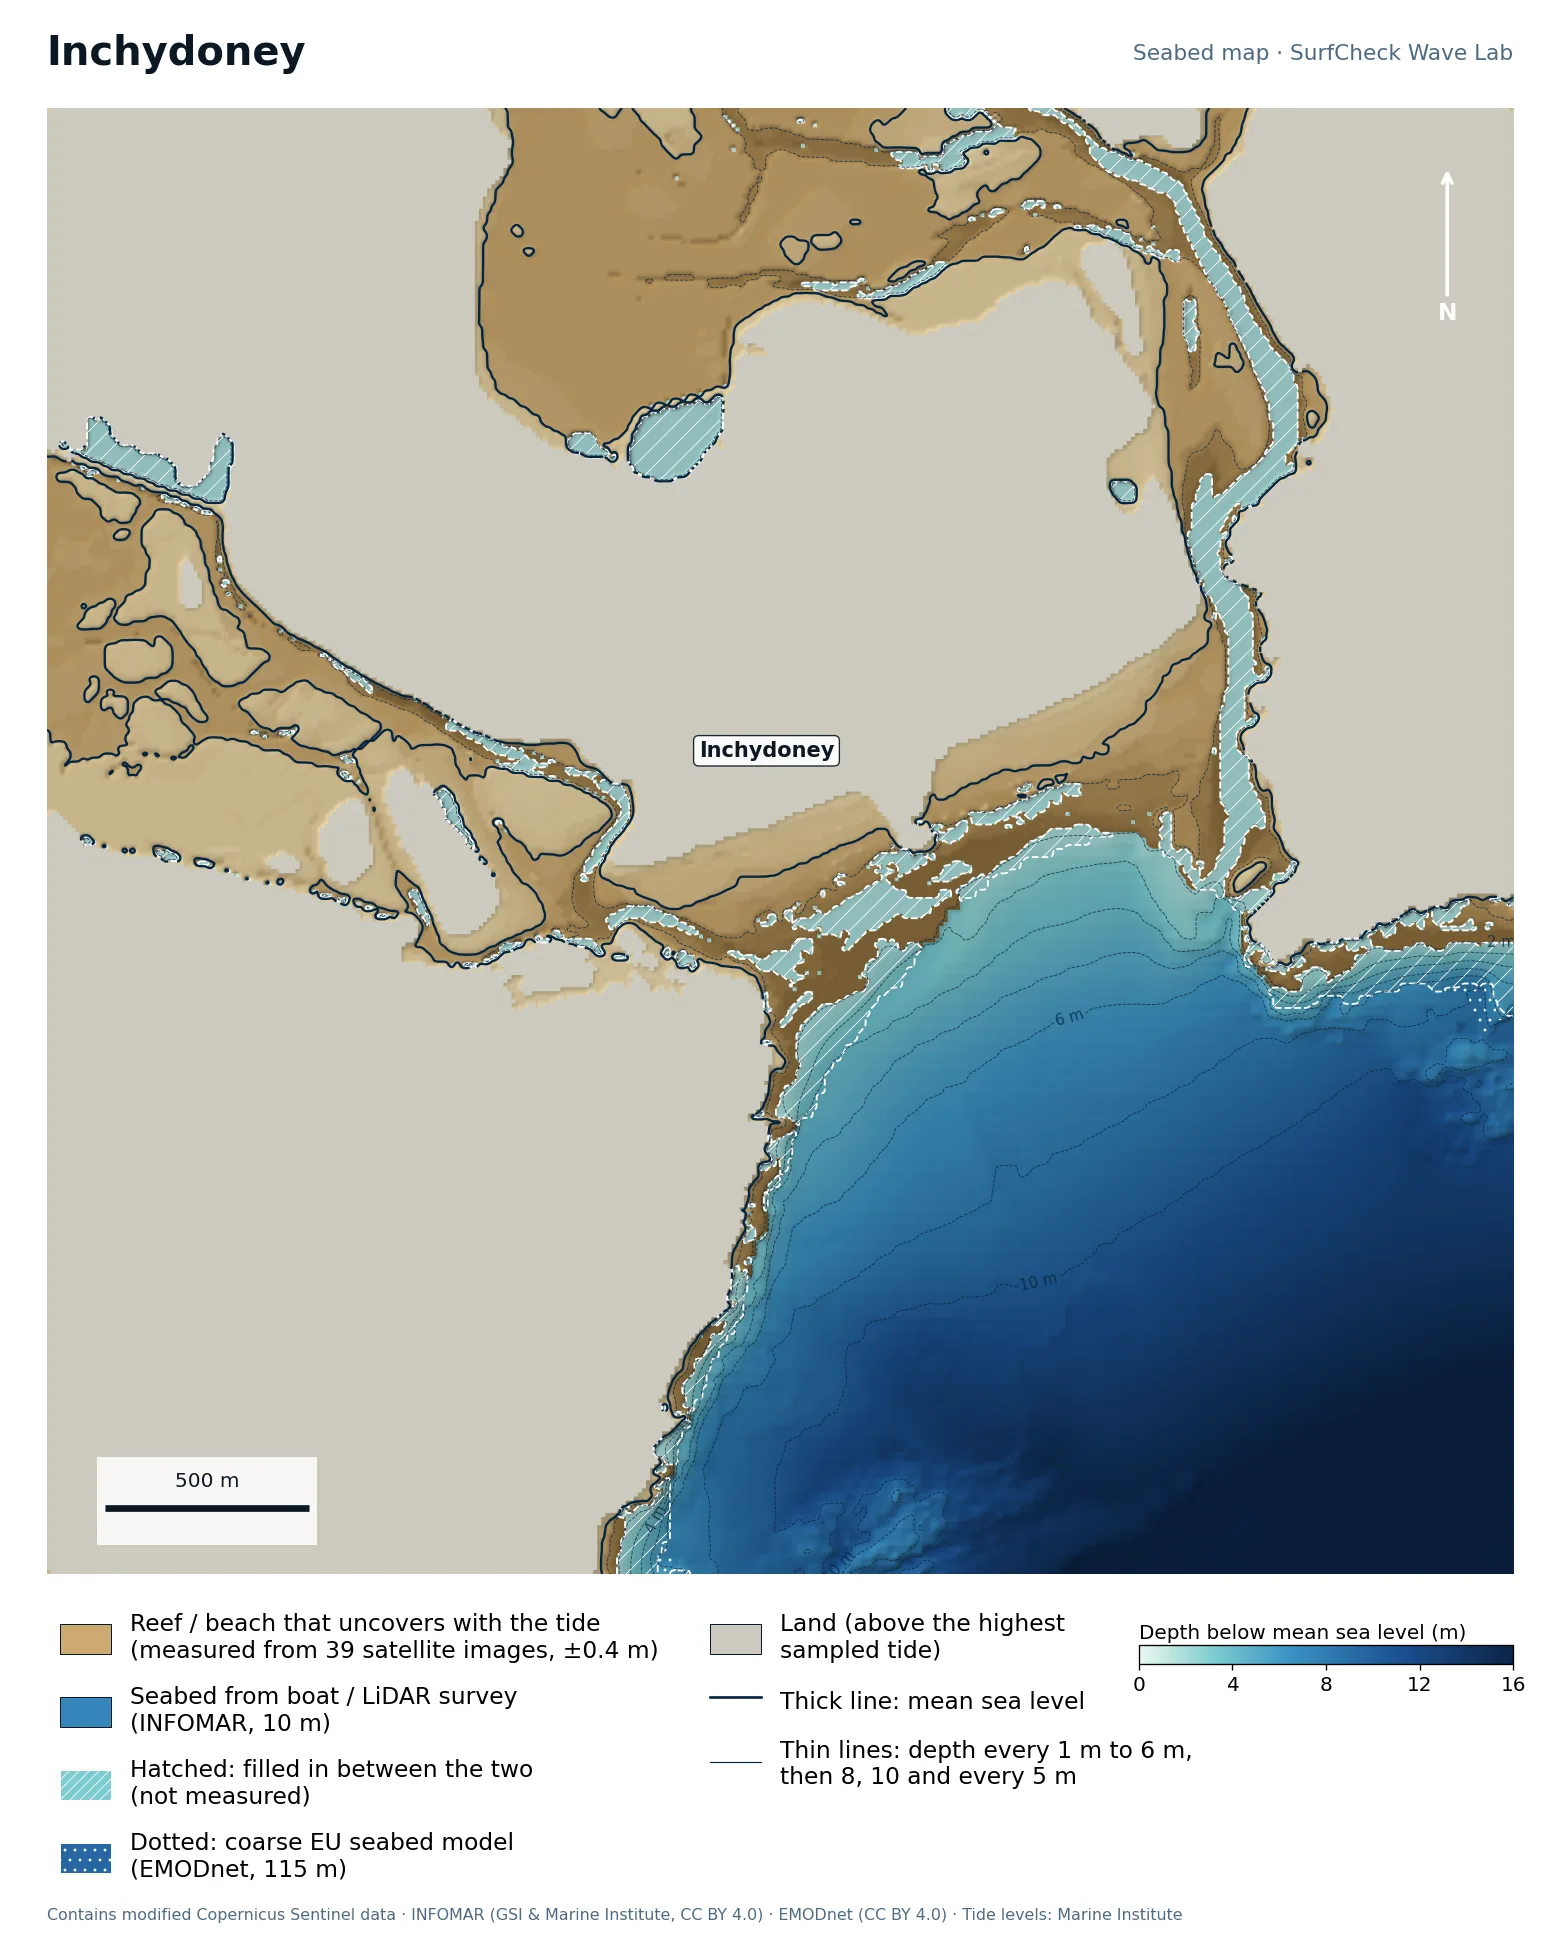
Seabed map of Inchydoney: depth contours, the reef or beach that uncovers with the tide, and which parts are measured
91%
of the sea here is measured
268 ha
uncovers with the tide
39
satellite images used
30 m
filled-in band, typical width

What the seabed shows

A rocky headland with a beach on each side, and behind them two estuaries whose sandflats cover nearly 300 hectares at low tide. Each beach has a river channel running out beside it. Outside, the seabed drops steadily to about 12 m with no reefs, so the shape of the waves comes from the sand and the channels.

How sure we are

91% measured: the bay is boat-surveyed and the beaches and sandflats are mapped from 39 satellite images. The channels shift from year to year, so their position here is an average of 2018 to 2024.

In the Wave Lab

In the model, works hardest on swell from roughly 160° at 17 s (+33% against its own average); weakest from 190° at 12 s (-33%). Breakers are about 20% bigger at low tide than at high.

Forecast and tides See it in 3D Run it in the Wave Lab

Co. Waterford · Wide, gentle bay

Tramore

Well measured
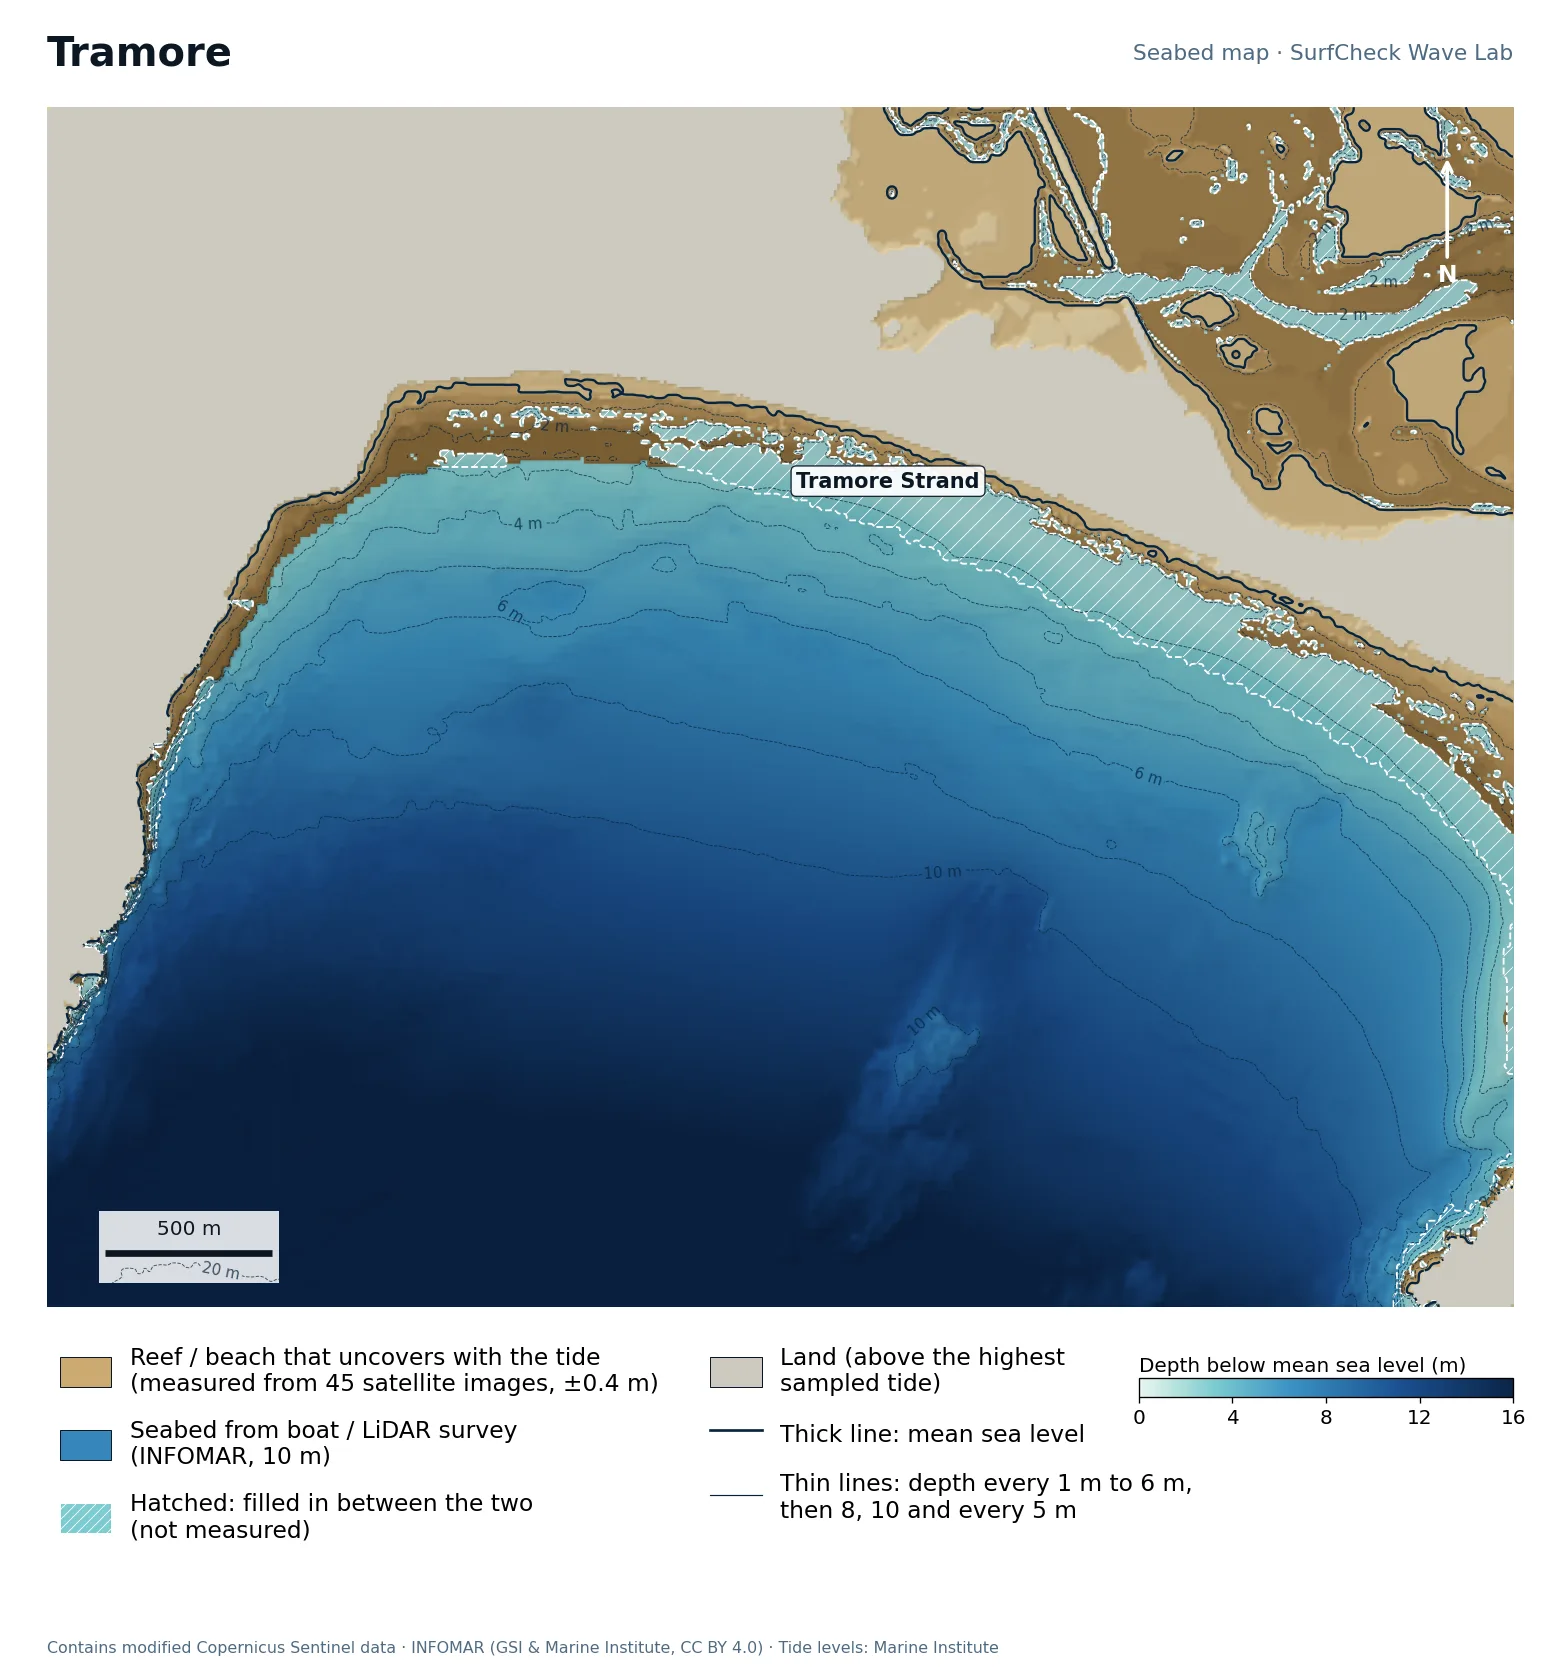
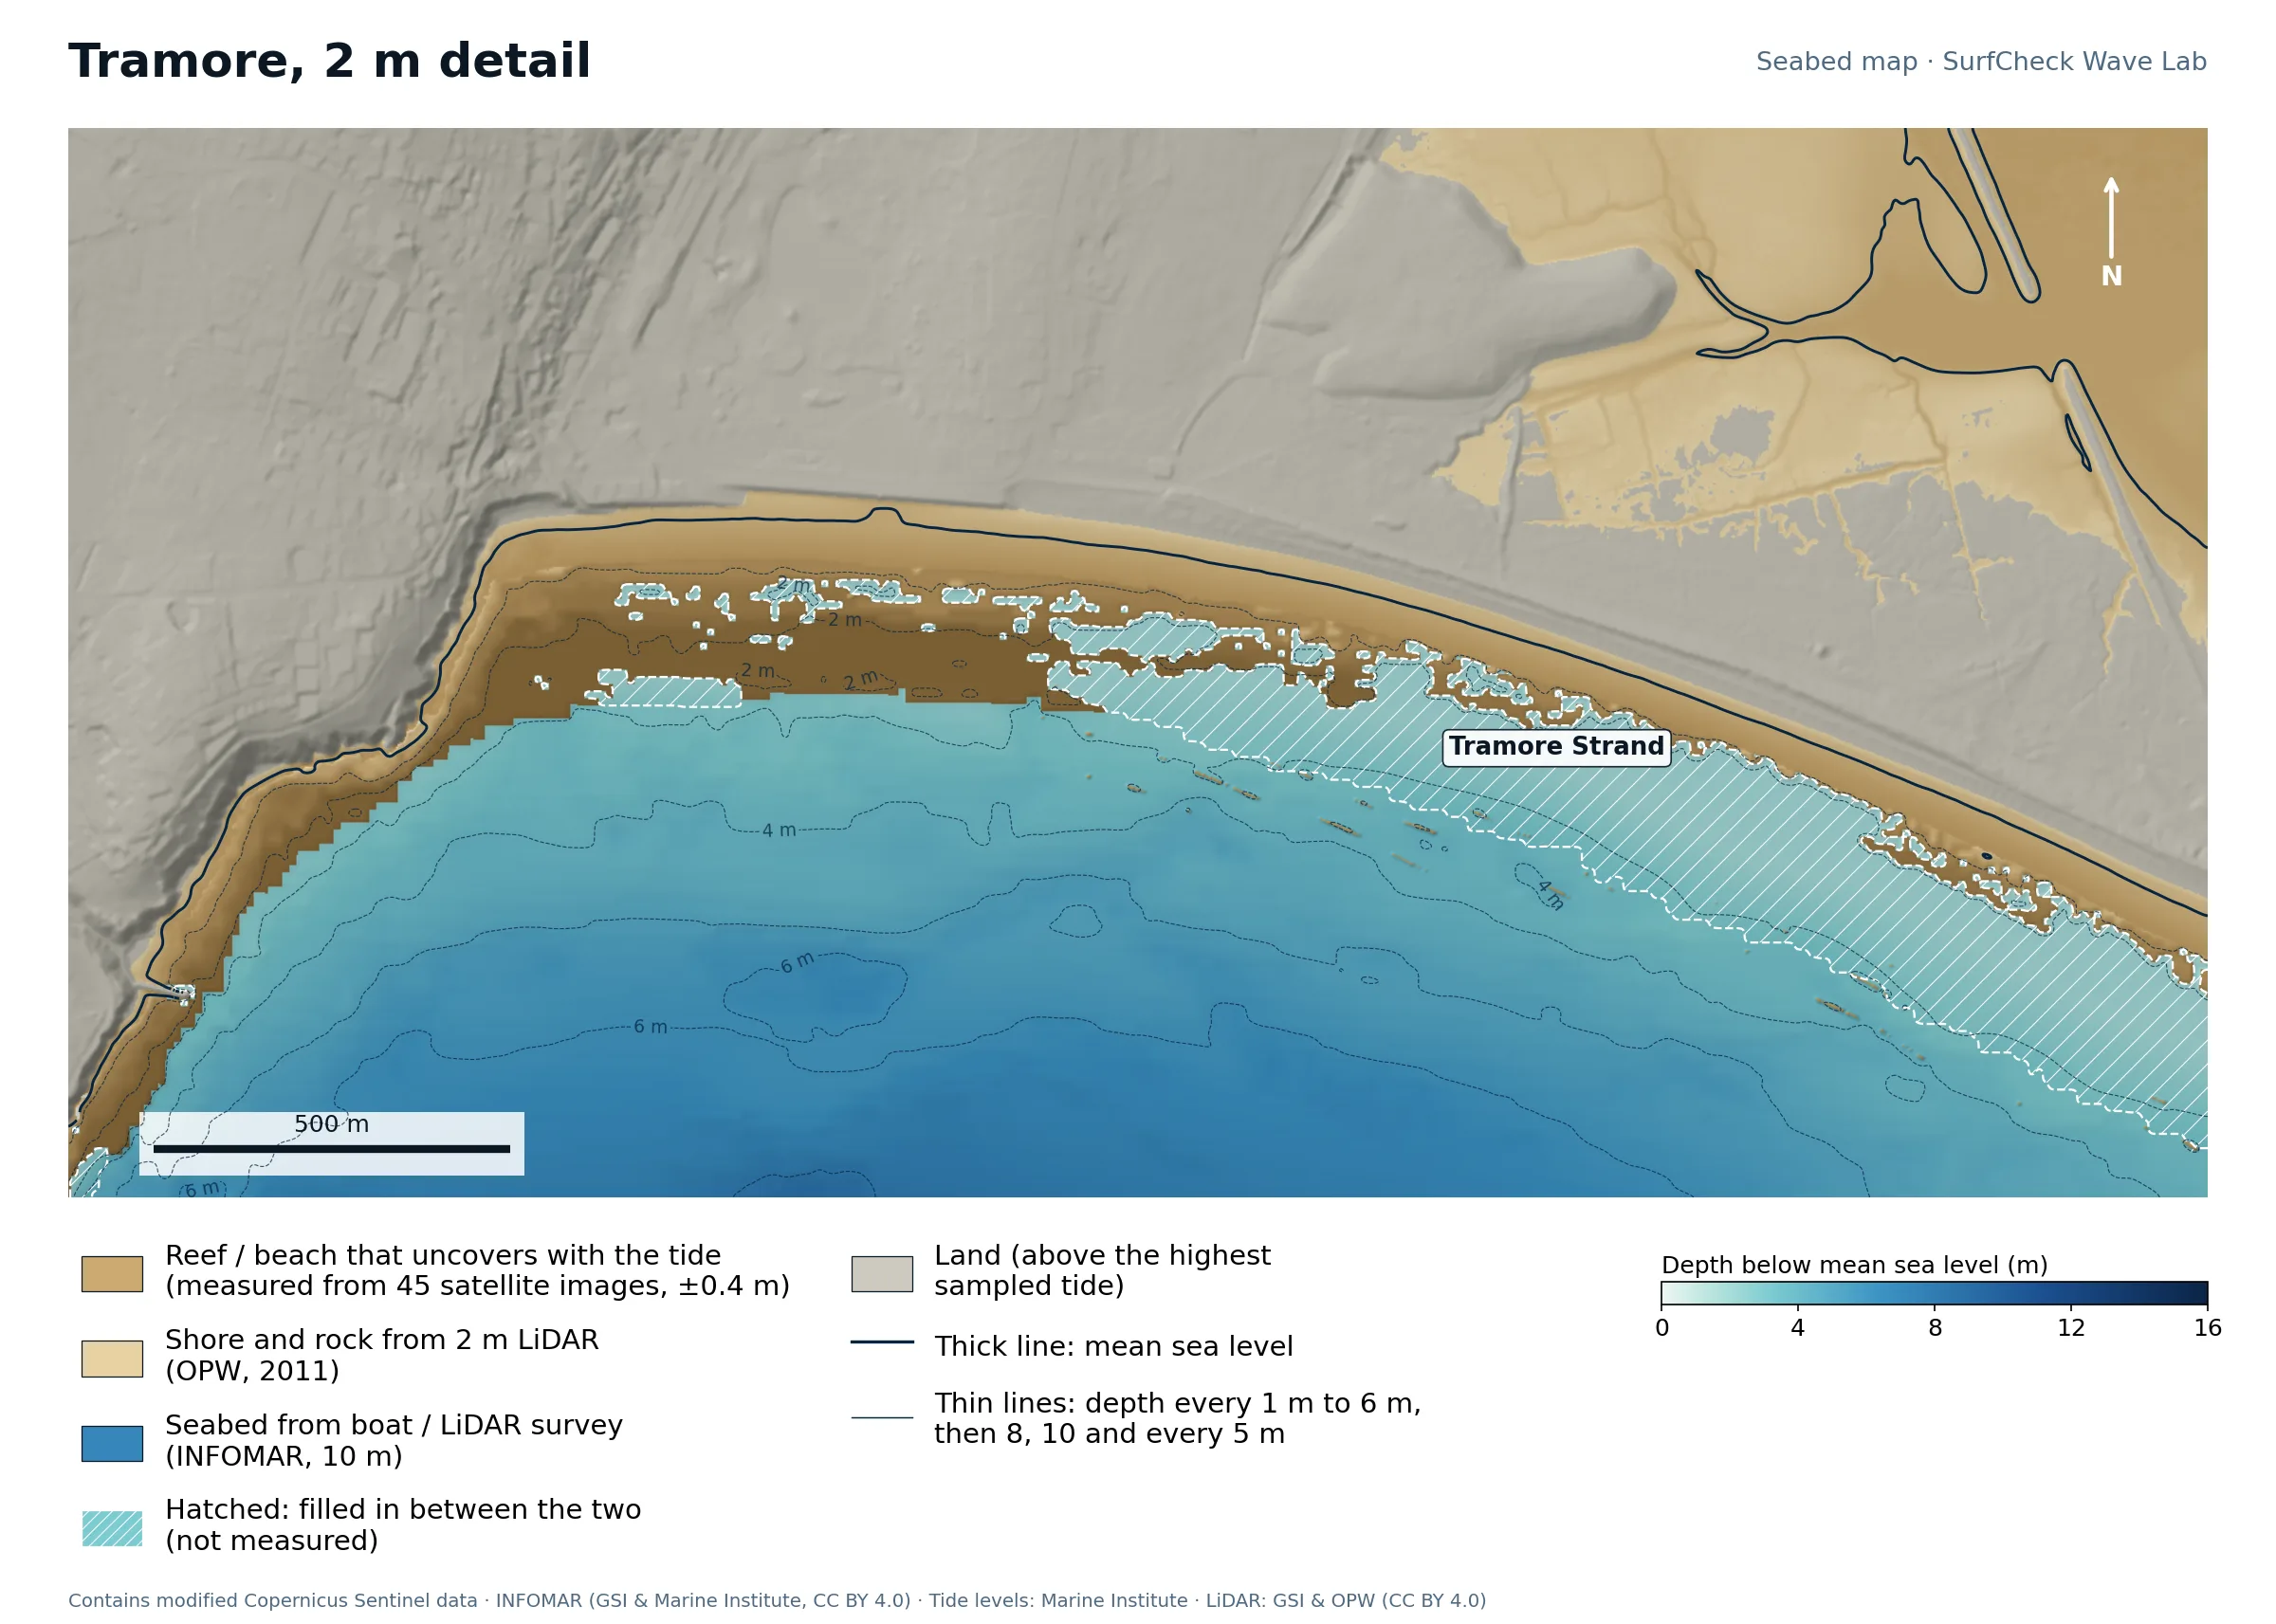
Seabed map of Tramore: depth contours, the reef or beach that uncovers with the tide, and which parts are measuredClose-up of Tramore in finer detail from LiDAR
93%
of the sea here is measured
236 ha
uncovers with the tide
45
satellite images used
40 m
filled-in band, typical width

What the seabed shows

A south-facing strand five kilometres long, backed by dunes and a tidal lagoon. The bay shelves very slowly: the 6 m line is more than a kilometre out. Waves break early and lose energy on the way in, which makes Tramore soft and suits it to learning. The 2 m map shows the shore, promenade and dunes in fine detail.

How sure we are

93% measured. The bay floor is survey data right up to the beach, and the upper shore is 2 m LiDAR. Only a thin strip is filled in.

In the Wave Lab

Swell direction is too close to call: the model cannot separate directions that differ by less than about 30% in breaker size. Tide changes breaker size by under 4%.

Forecast and tides See it in 3D Run it in the Wave Lab

Taghazout, Morocco · Right-hand point break

Anchor Point

Shore only
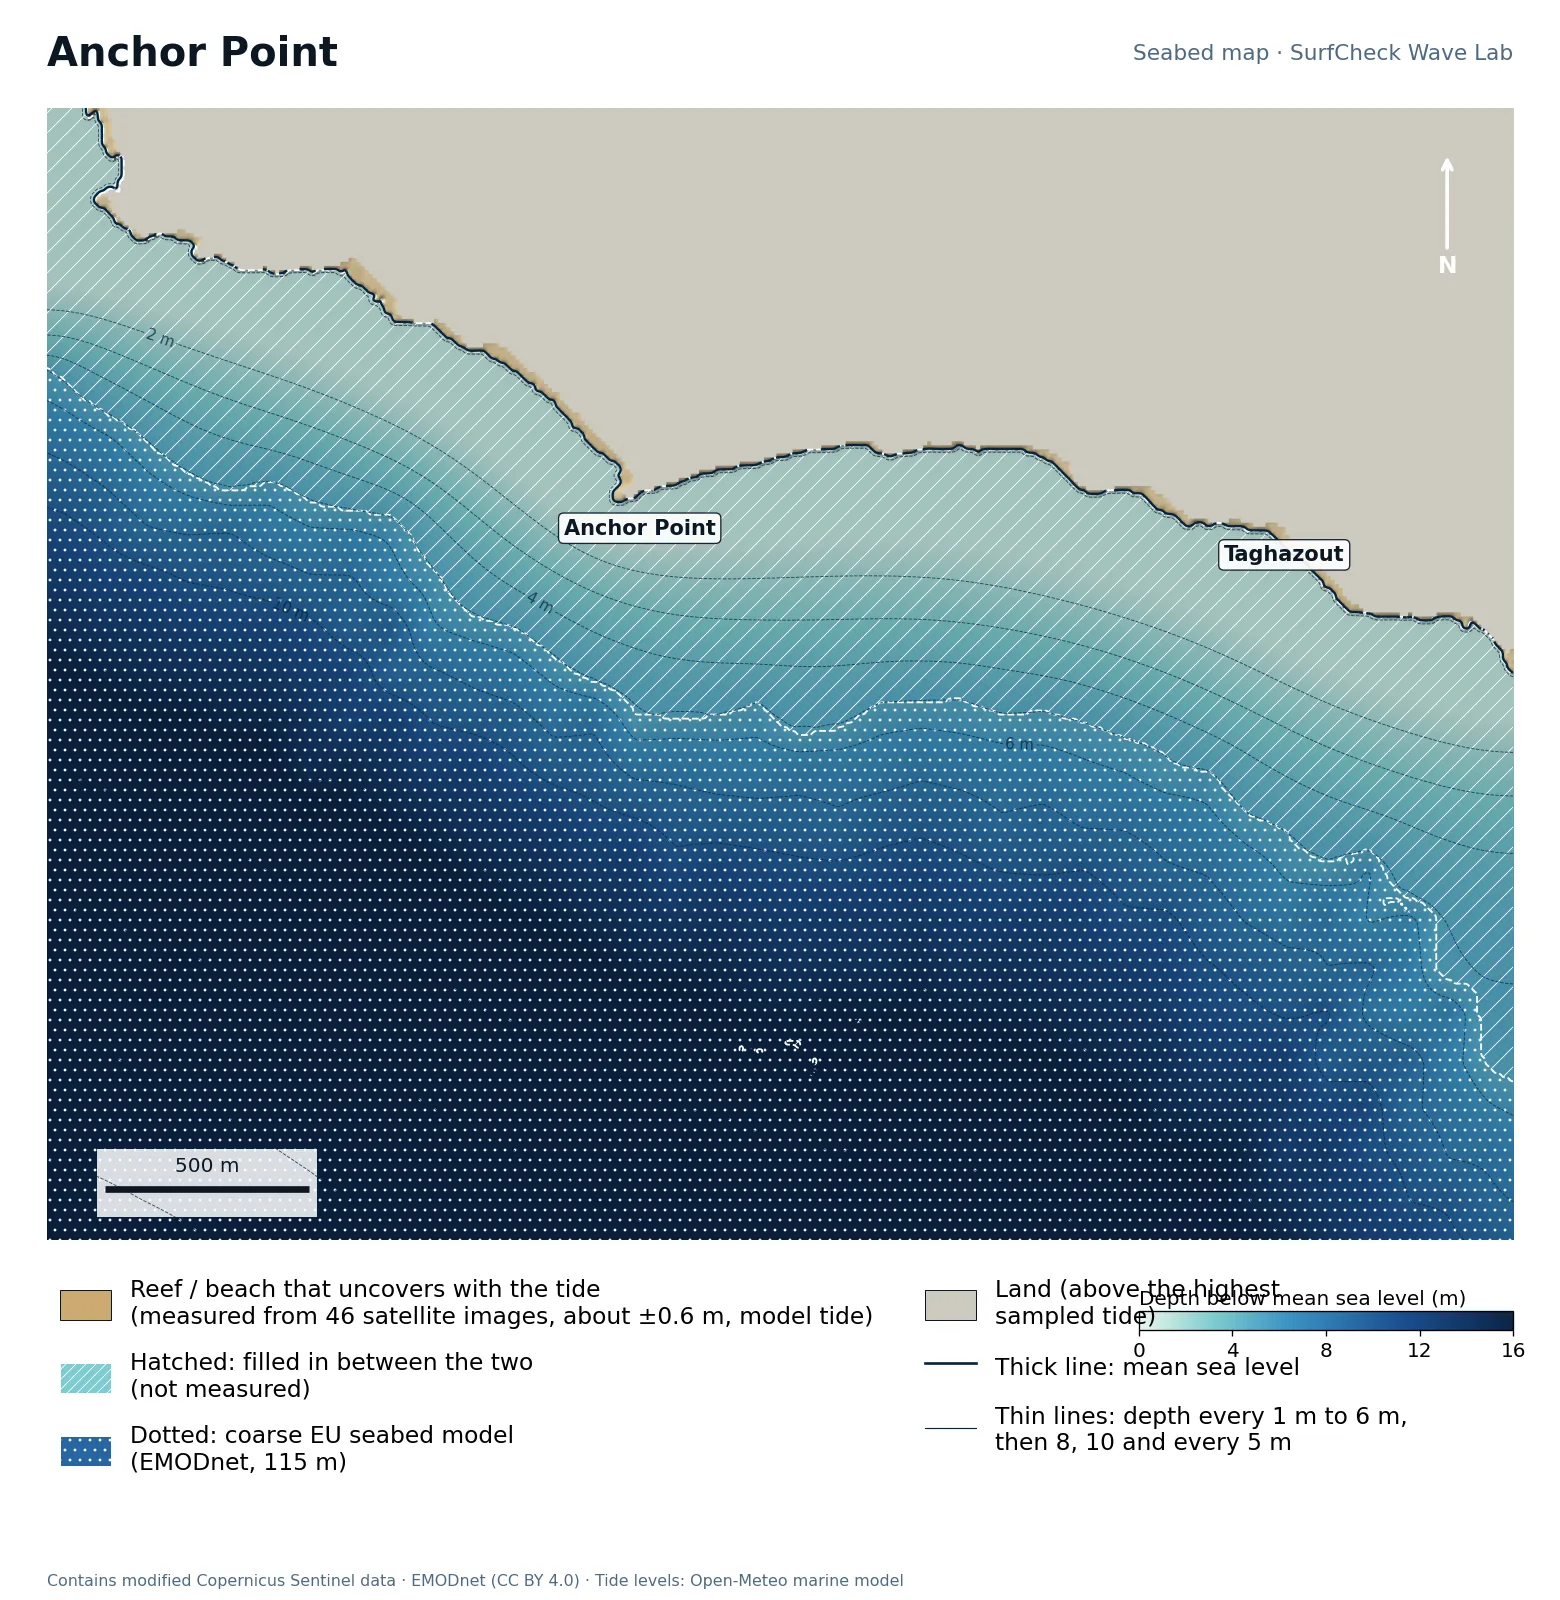
Seabed map of Anchor Point: depth contours, the reef or beach that uncovers with the tide, and which parts are measured
1%
of the sea here is measured
7 ha
uncovers with the tide
46
satellite images used
560 m
filled-in band, typical width

What the seabed shows

A rock point north of Taghazout village with open Atlantic to the north-west. The map shows the point and the narrow rock shelf along it; what it cannot show is the seabed the wave actually runs over.

How sure we are

Shore only. The shoreline and the rock that uncovers are mapped from 46 satellite images, with the tide taken from an ocean model (about ±0.6 m). No open detailed seabed survey exists here, so everything out to the coarse EU model is filled in. Whitewater fools the satellite method on a coast that is always breaking, so we kept only pixels that follow the tide and touch the shore.

Forecast and tides Run it in the Wave Lab

Morocco · Very long right in a sheltered bay

Imsouane

Shore only
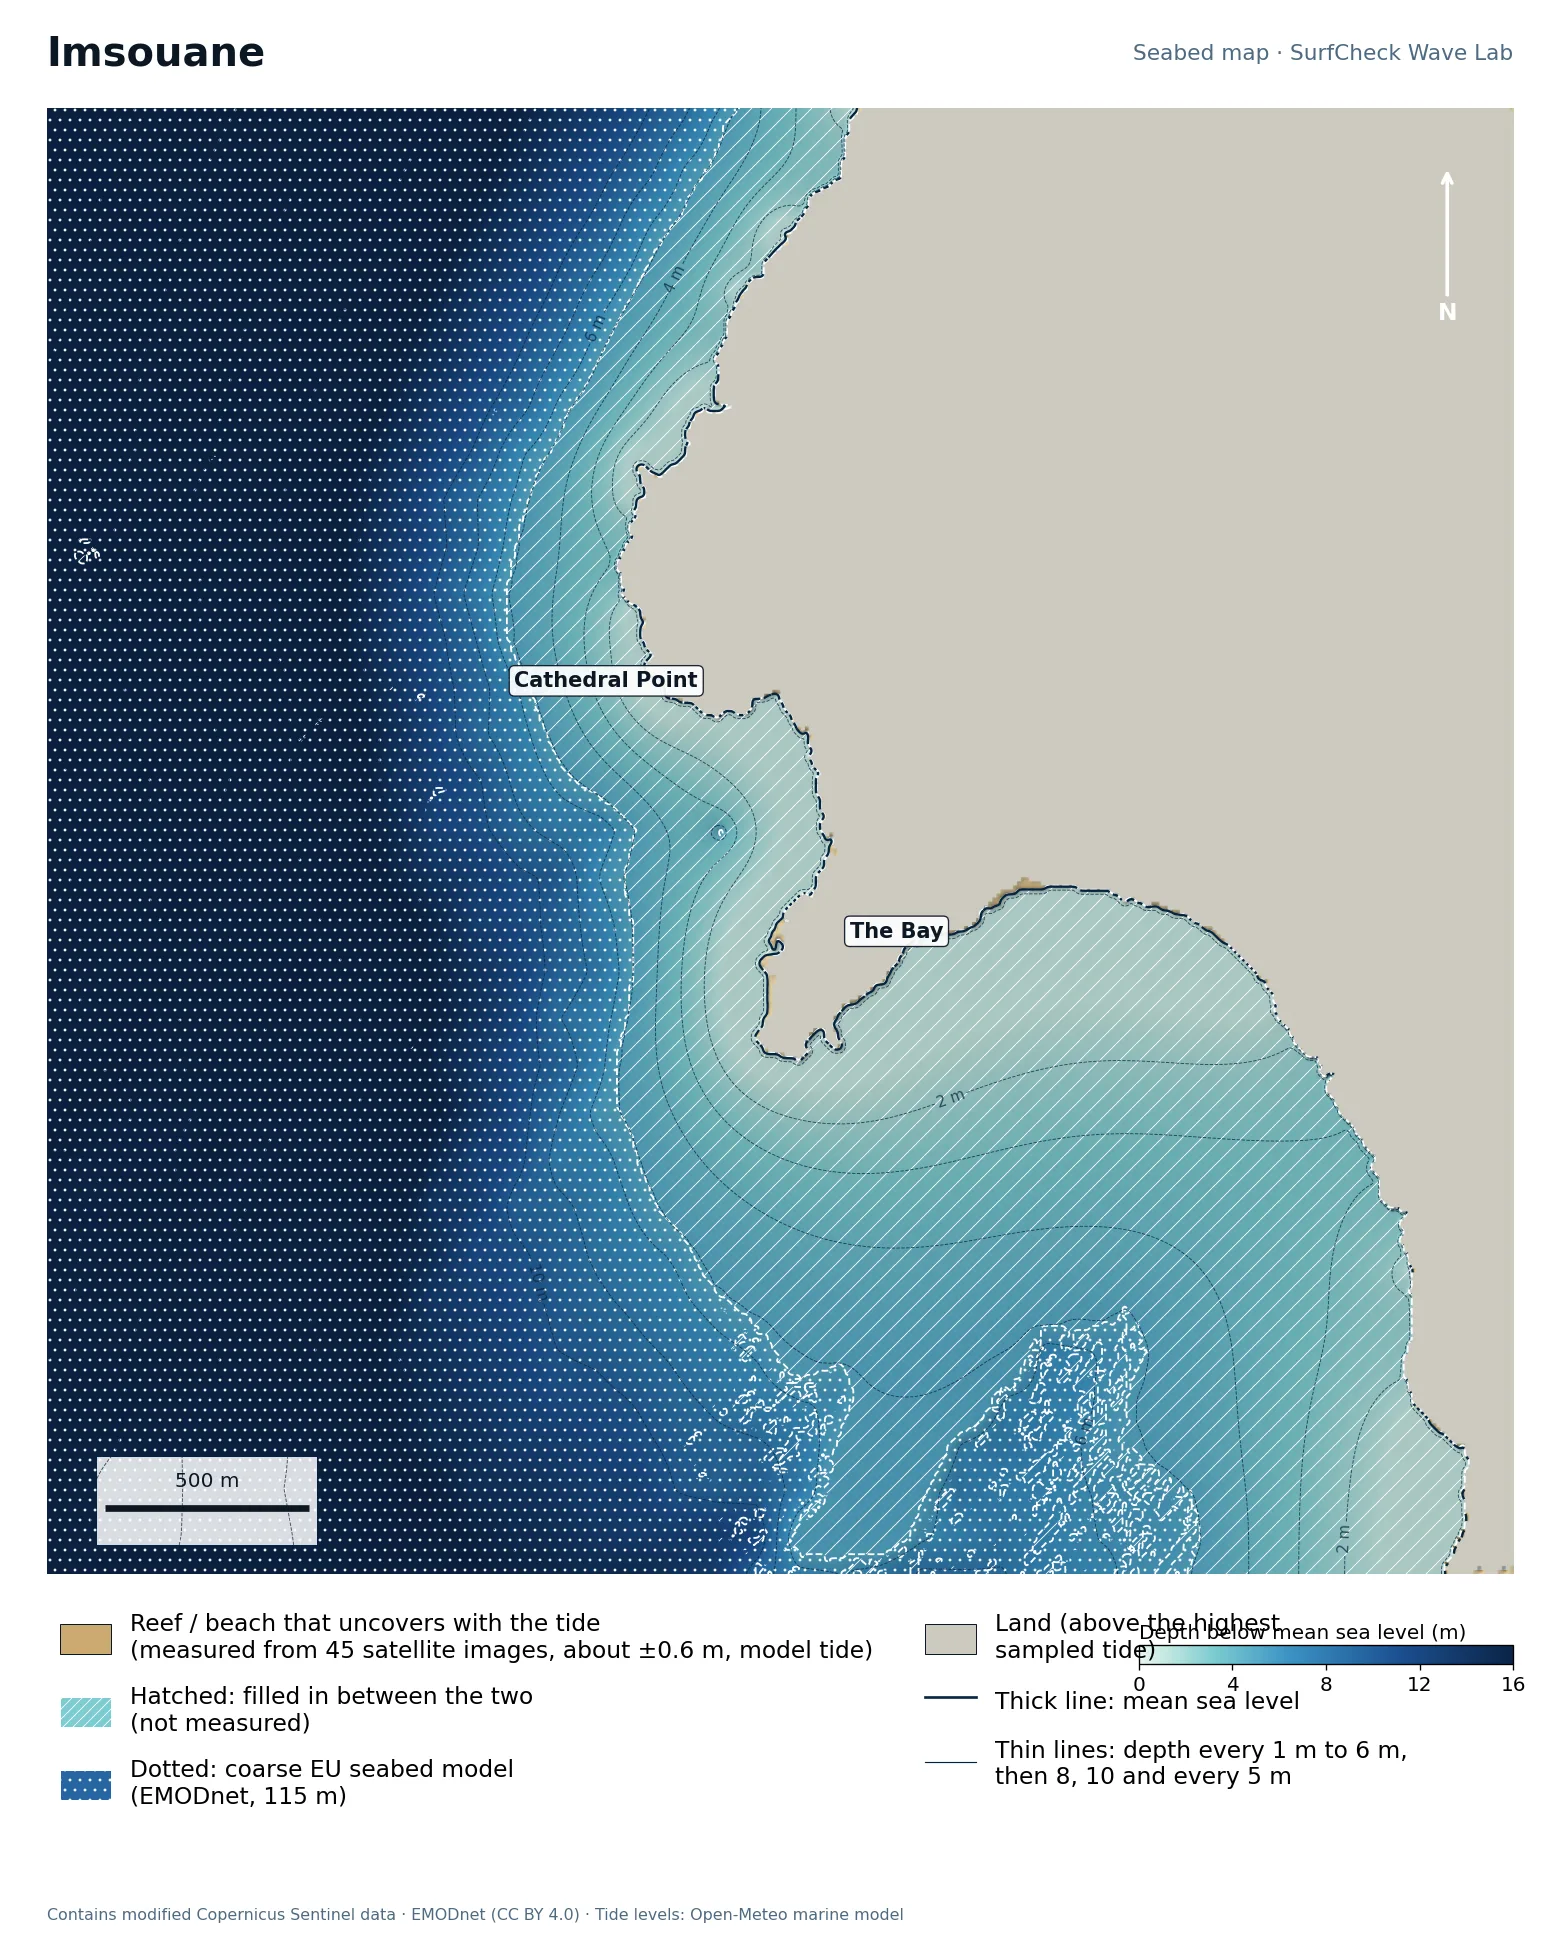
Seabed map of Imsouane: depth contours, the reef or beach that uncovers with the tide, and which parts are measured
0%
of the sea here is measured
2 ha
uncovers with the tide
45
satellite images used
1770 m
filled-in band, typical width

What the seabed shows

A headland (Cathedral Point) with a wide sand bay tucked in behind it, facing south-west. The bay floor is shallow and flat for a long way, which is the setting for one of the longest rides in Africa.

How sure we are

Shore only. The shoreline and the rock that uncovers are mapped from 45 satellite images, with the tide taken from an ocean model (about ±0.6 m). No open detailed seabed survey exists here, so everything out to the coarse EU model is filled in. Whitewater fools the satellite method on a coast that is always breaking, so we kept only pixels that follow the tide and touch the shore.

Forecast and tides Run it in the Wave Lab

Portugal · Reef point in a World Surfing Reserve

Ericeira · Ribeira d’Ilhas

Shore only
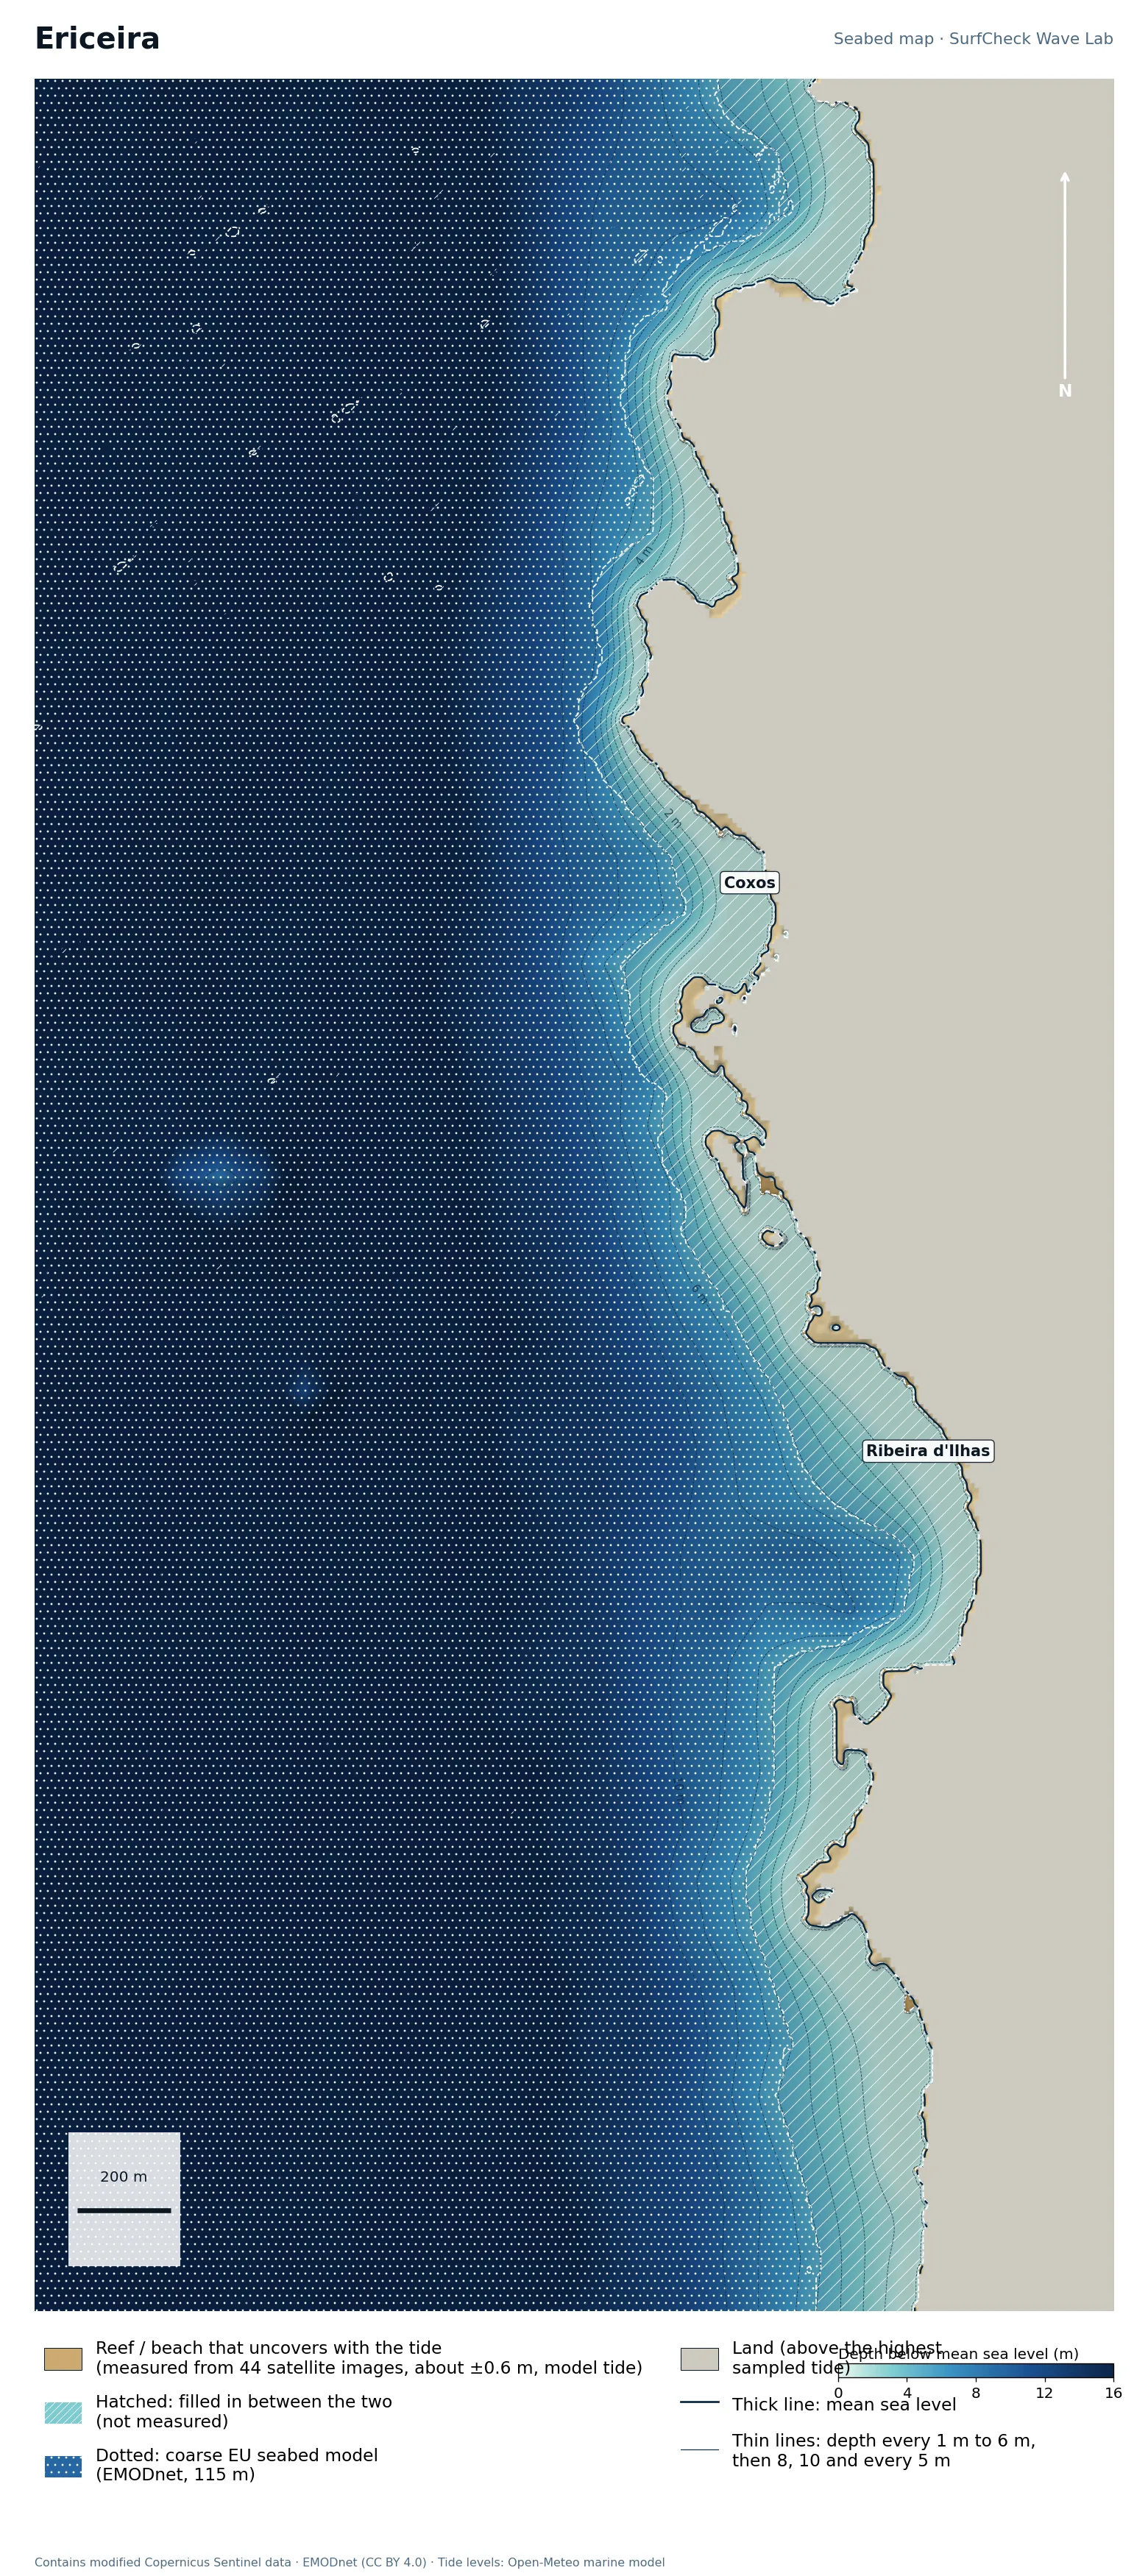
Seabed map of Ericeira · Ribeira d’Ilhas: depth contours, the reef or beach that uncovers with the tide, and which parts are measured
1%
of the sea here is measured
8 ha
uncovers with the tide
44
satellite images used
160 m
filled-in band, typical width

What the seabed shows

A cliffed coast cut by small bays, each floored with flat rock shelves. Ribeira d’Ilhas and Coxos both sit on this stretch.

How sure we are

Shore only. The shoreline and the rock that uncovers are mapped from 44 satellite images, with the tide taken from an ocean model (about ±0.6 m). No open detailed seabed survey exists here, so everything out to the coarse EU model is filled in. Whitewater fools the satellite method on a coast that is always breaking, so we kept only pixels that follow the tide and touch the shore.

Forecast and tides Run it in the Wave Lab

Portugal · Hollow beach break beside a peninsula

Peniche · Supertubos

Shore only
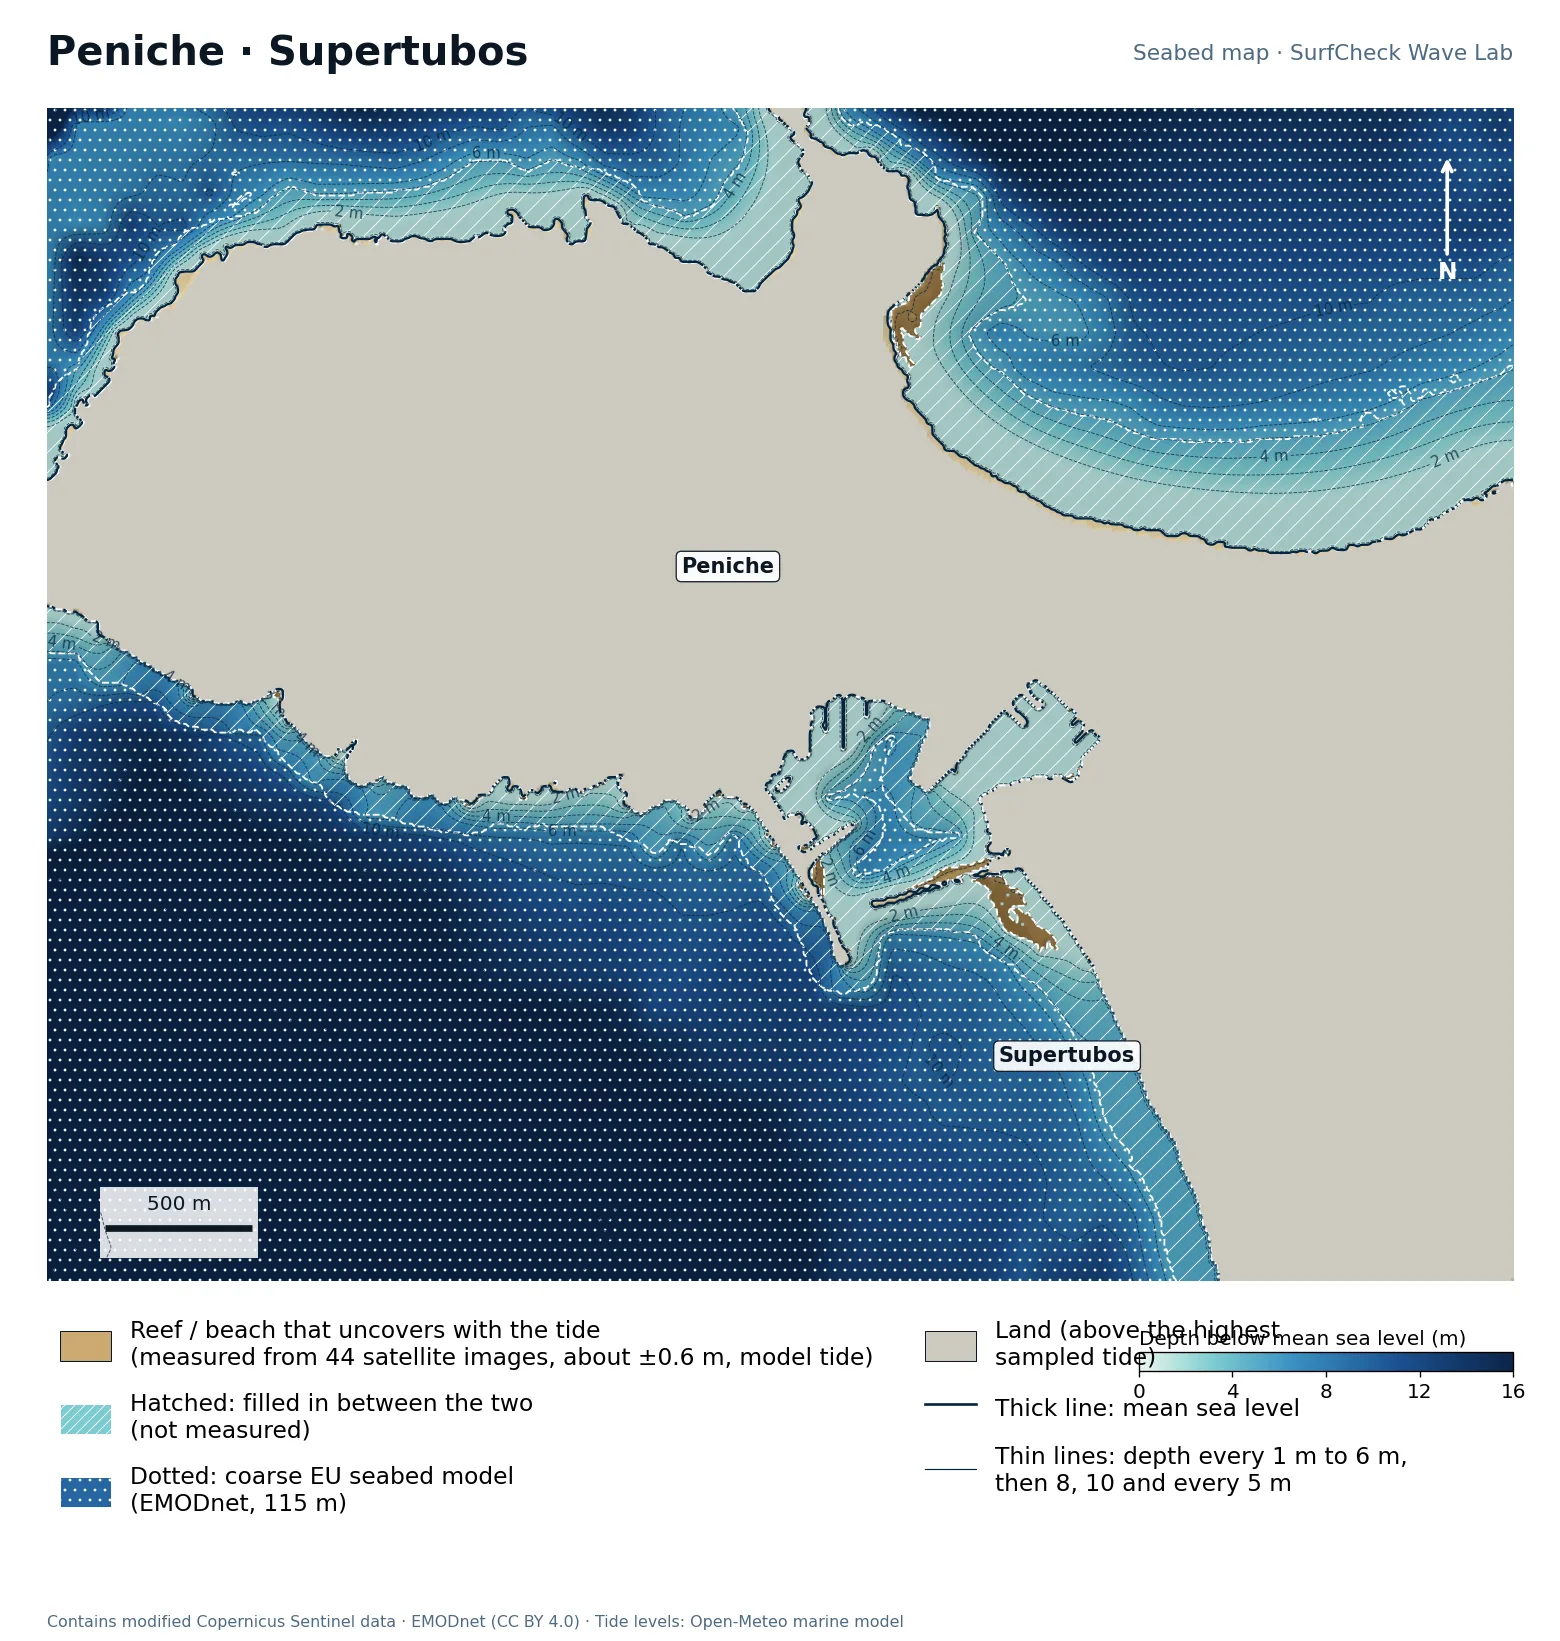
Seabed map of Peniche · Supertubos: depth contours, the reef or beach that uncovers with the tide, and which parts are measured
1%
of the sea here is measured
16 ha
uncovers with the tide
44
satellite images used
210 m
filled-in band, typical width

What the seabed shows

The Peniche peninsula sticks out west with a long sand bay on each side, so one side is usually offshore. Supertubos is on the south bay.

How sure we are

Shore only. The shoreline and the rock that uncovers are mapped from 44 satellite images, with the tide taken from an ocean model (about ±0.6 m). No open detailed seabed survey exists here, so everything out to the coarse EU model is filled in. Whitewater fools the satellite method on a coast that is always breaking, so we kept only pixels that follow the tide and touch the shore. Sandbars here move every season. A 2011 coastal LiDAR survey (APA/DGT, via EMODnet) has since been added to the Seabed 3D scene for Supertubos; this map will be redrawn from it.

Forecast and tides See it in 3D Run it in the Wave Lab

Co. Antrim · Two strands split by a headland

Portrush

Shore only
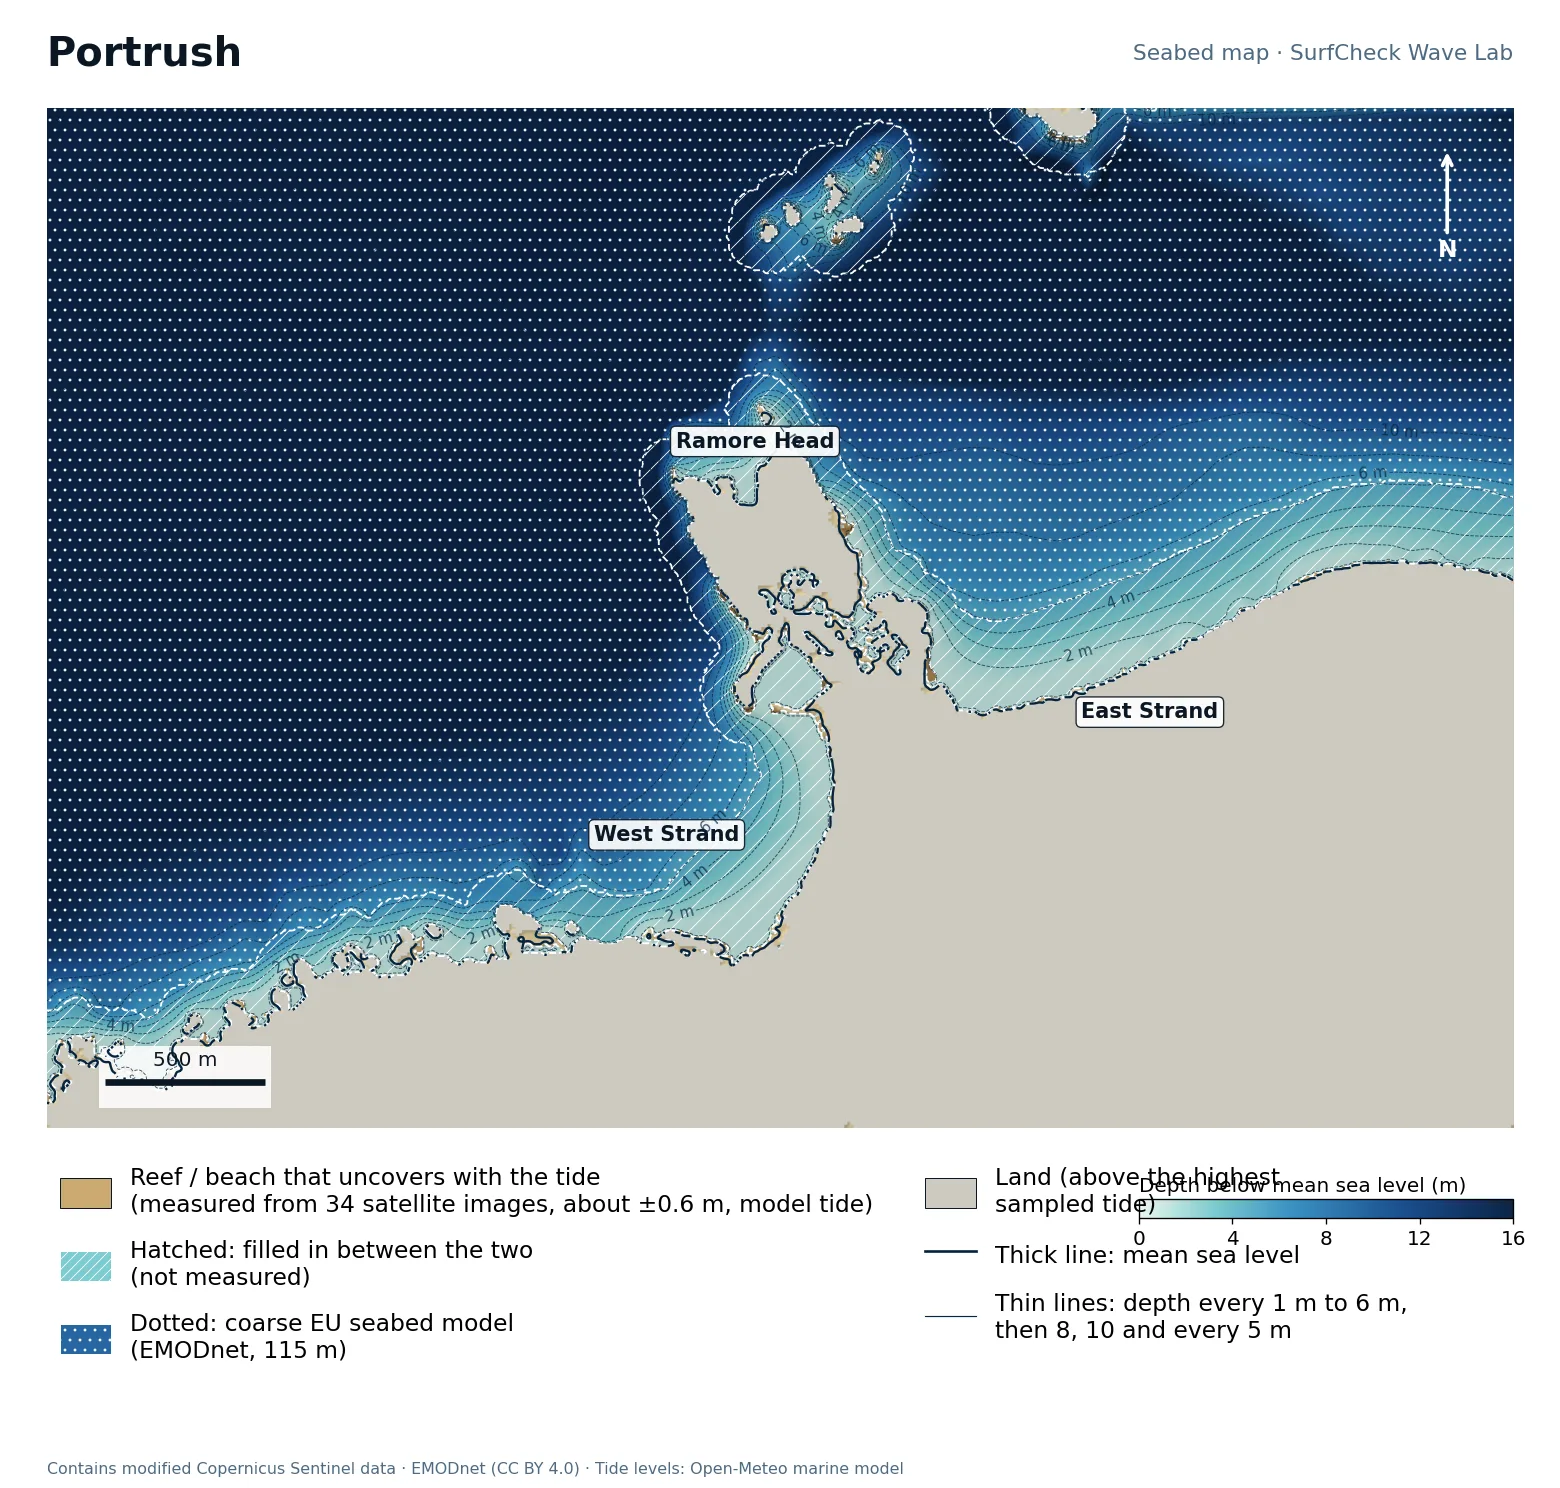
Seabed map of Portrush: depth contours, the reef or beach that uncovers with the tide, and which parts are measured
1%
of the sea here is measured
11 ha
uncovers with the tide
34
satellite images used
160 m
filled-in band, typical width

What the seabed shows

Ramore Head divides West Strand from East Strand, with the Skerries islands a kilometre or two offshore. The tidal range here is small, so less of the shore uncovers than further west.

How sure we are

Shore only. The shoreline and the rock that uncovers are mapped from 34 satellite images, with the tide taken from an ocean model (about ±0.6 m). No open detailed seabed survey exists here, so everything out to the coarse EU model is filled in. Whitewater fools the satellite method on a coast that is always breaking, so we kept only pixels that follow the tide and touch the shore. Northern Ireland’s 2021 coastal survey is open-licensed but not yet published as raw depths; with it this would be a well-measured map.

Forecast and tides: East Strand West Strand Run it in the Wave Lab

Newquay, Cornwall · West-facing beach break

Fistral

Well measured
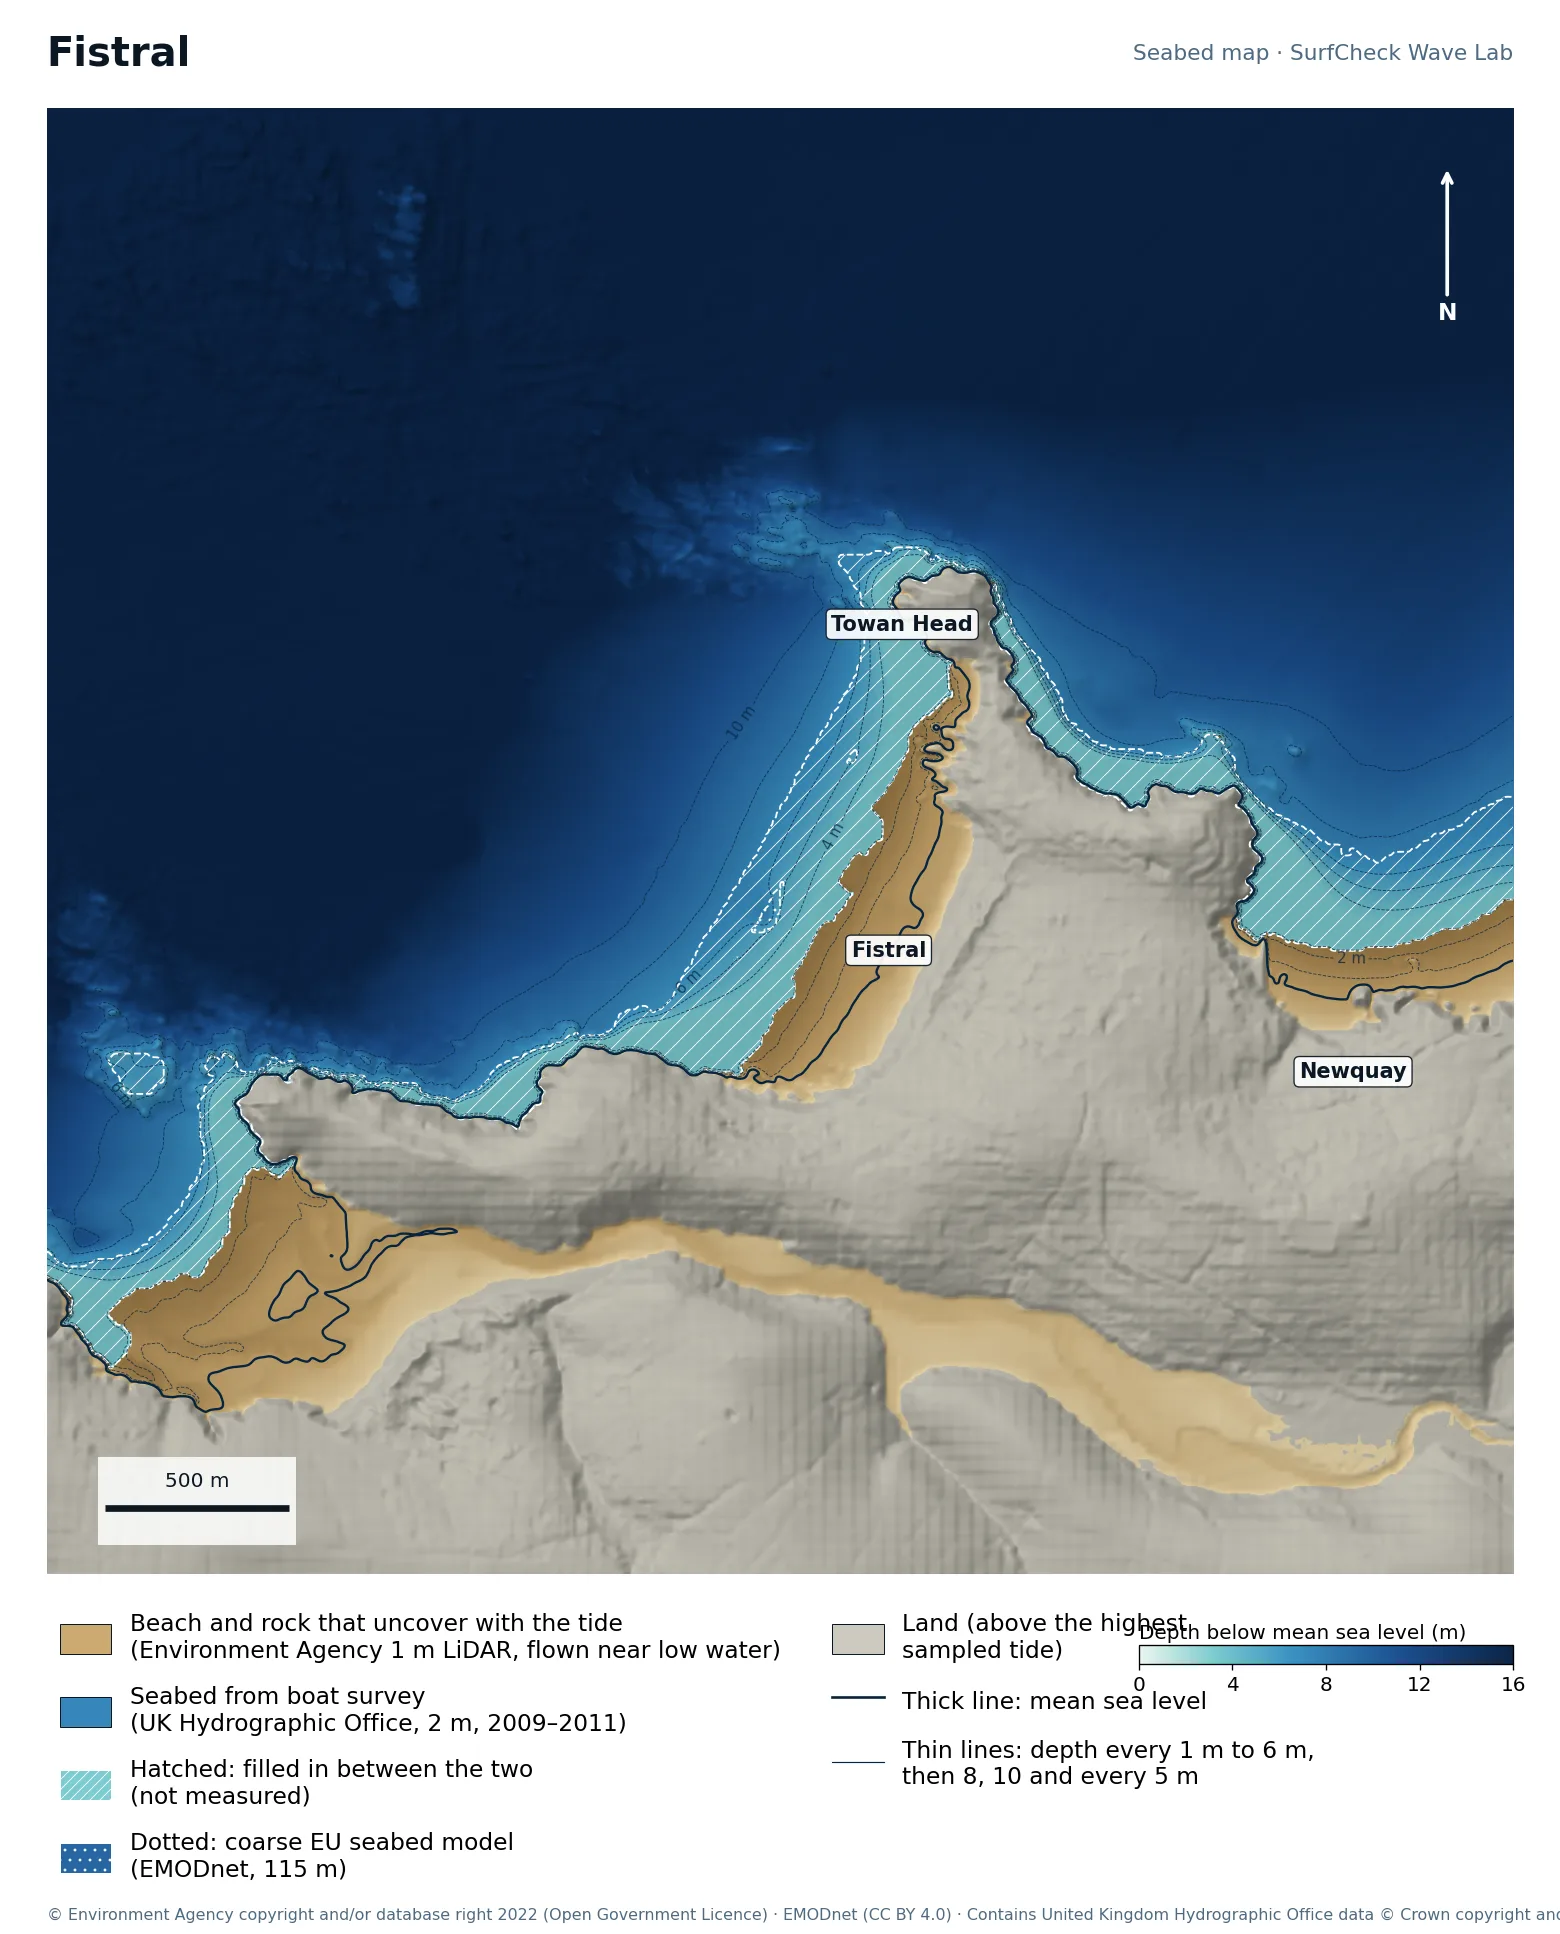
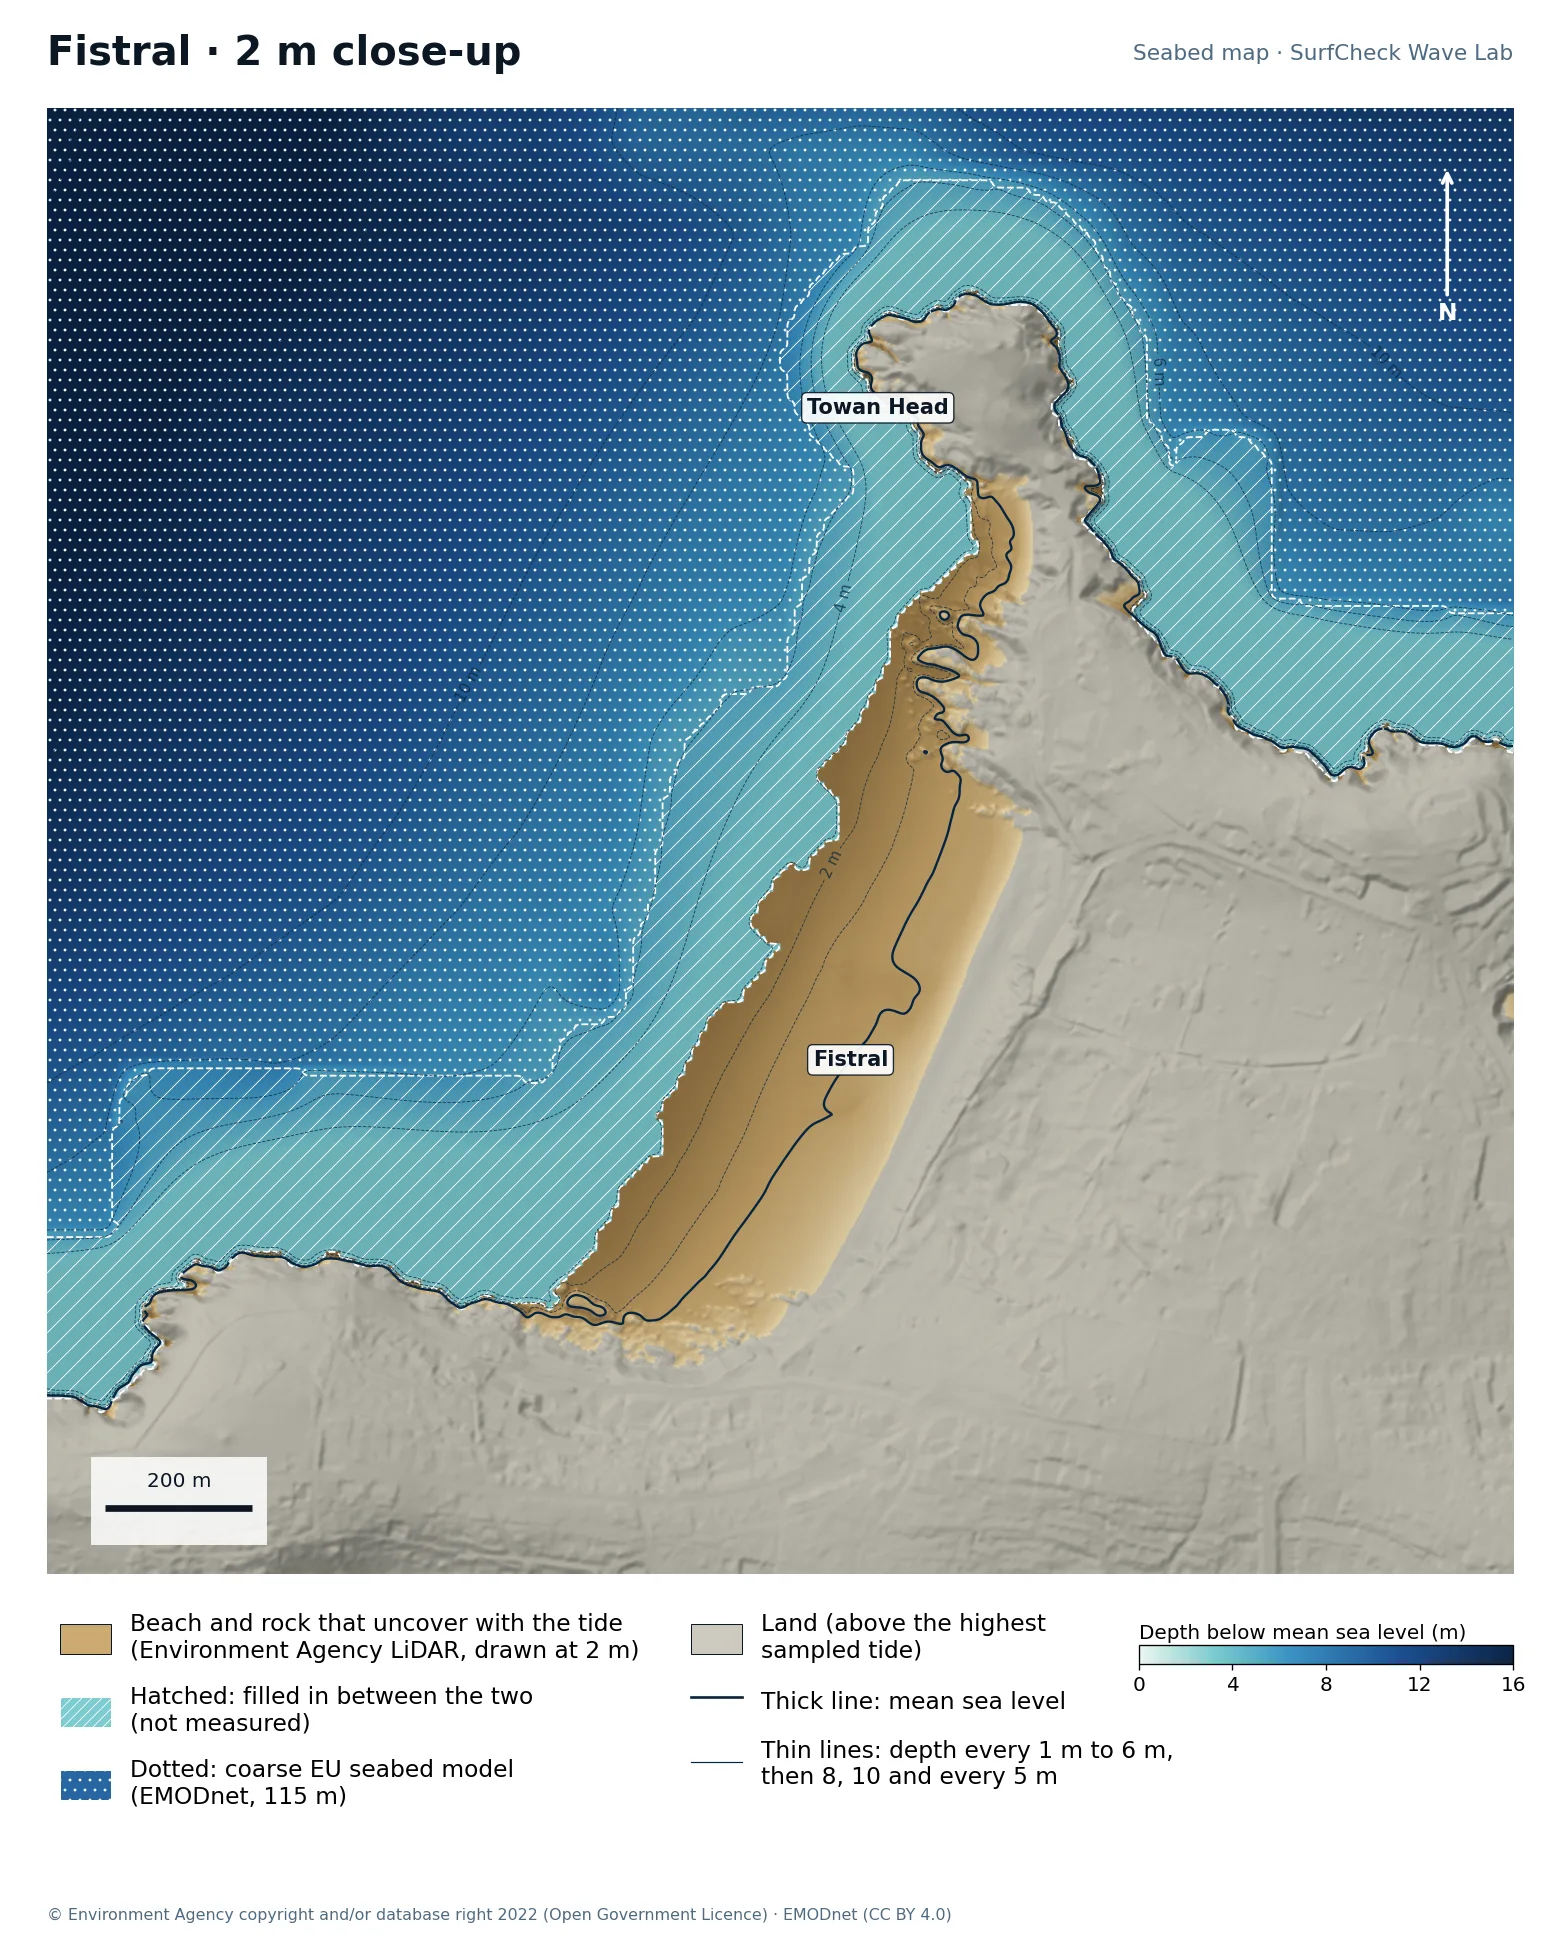
Seabed map of Fistral: depth contours, the reef or beach that uncovers with the tide, and which parts are measuredClose-up of Fistral in finer detail from LiDAR
92%
of the sea here is measured
133 ha
uncovers with the tide
1 m
LiDAR on the beach
170 m
filled-in band, typical width

What the seabed shows

A straight beach about 700 m long between Towan Head and Pentire Point, facing west-north-west into open Atlantic. The sand slopes evenly, and with a tide range over 6 m the break moves a long way up and down it. The map also shows the Gannel estuary to the south.

How sure we are

92% of the sea here is measured. The beach is Environment Agency 1 m airborne LiDAR and the seabed beyond is a UK Hydrographic Office 2 m boat survey (2009 to 2011). A band about 170 m wide between them is filled in. Sand moves, so the bars are as surveyed.

In the Wave Lab

Swell direction is too close to call: the model cannot separate directions that differ by less than about 30% in breaker size. Breakers are about 16% bigger at high tide than at low.

Forecast and tides Run it in the Wave Lab

North Devon · Compact bay between two headlands

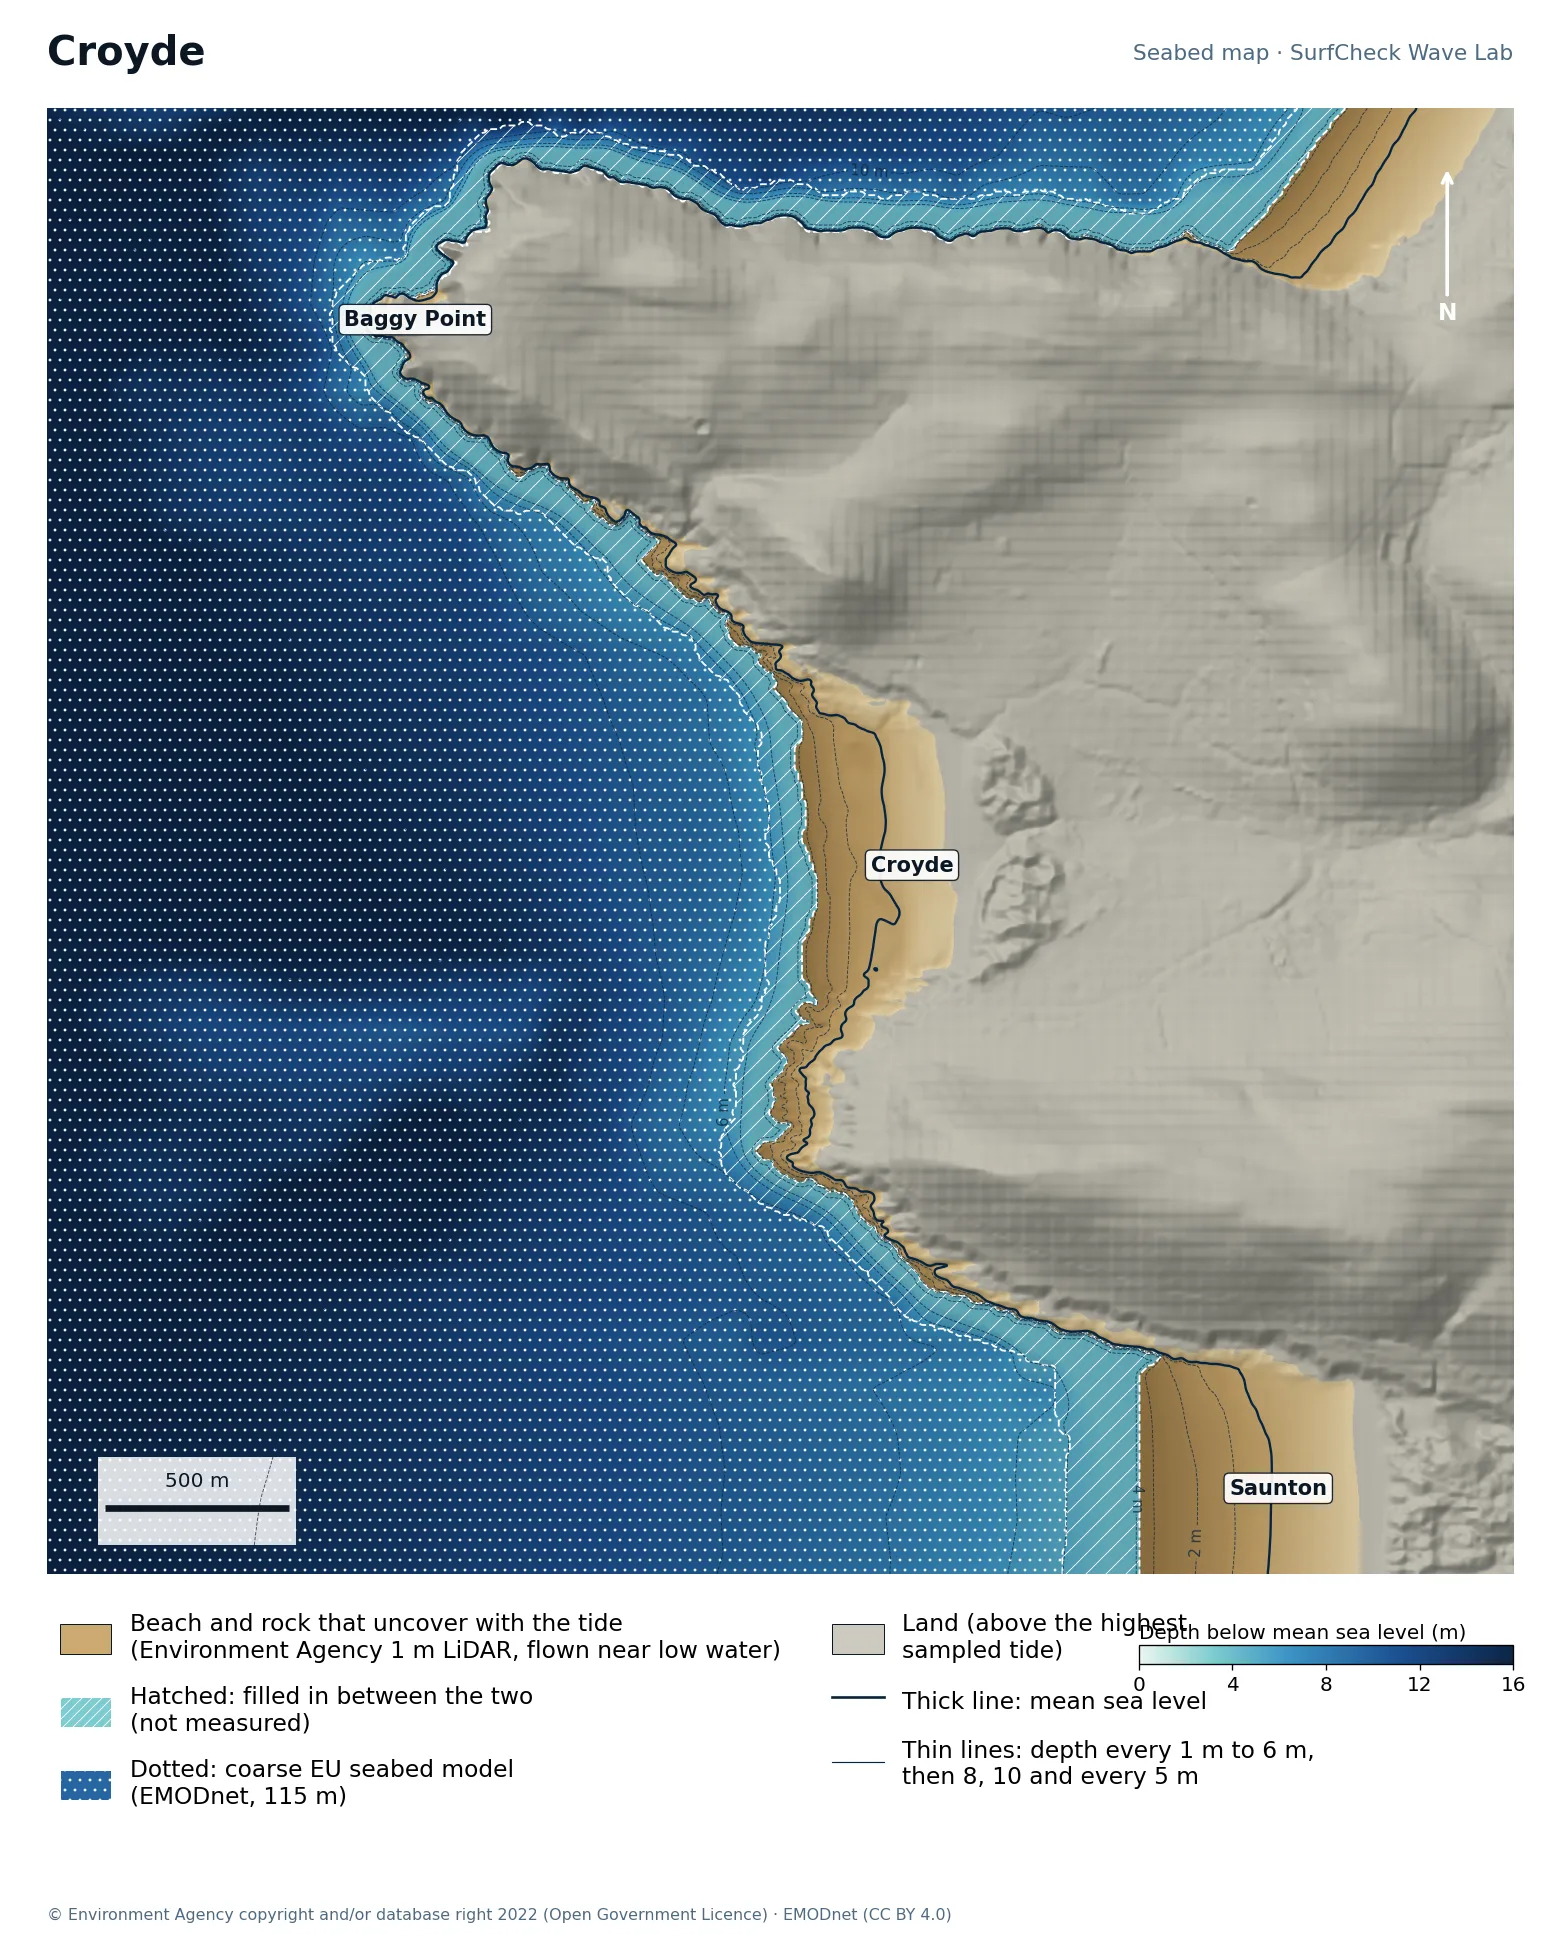
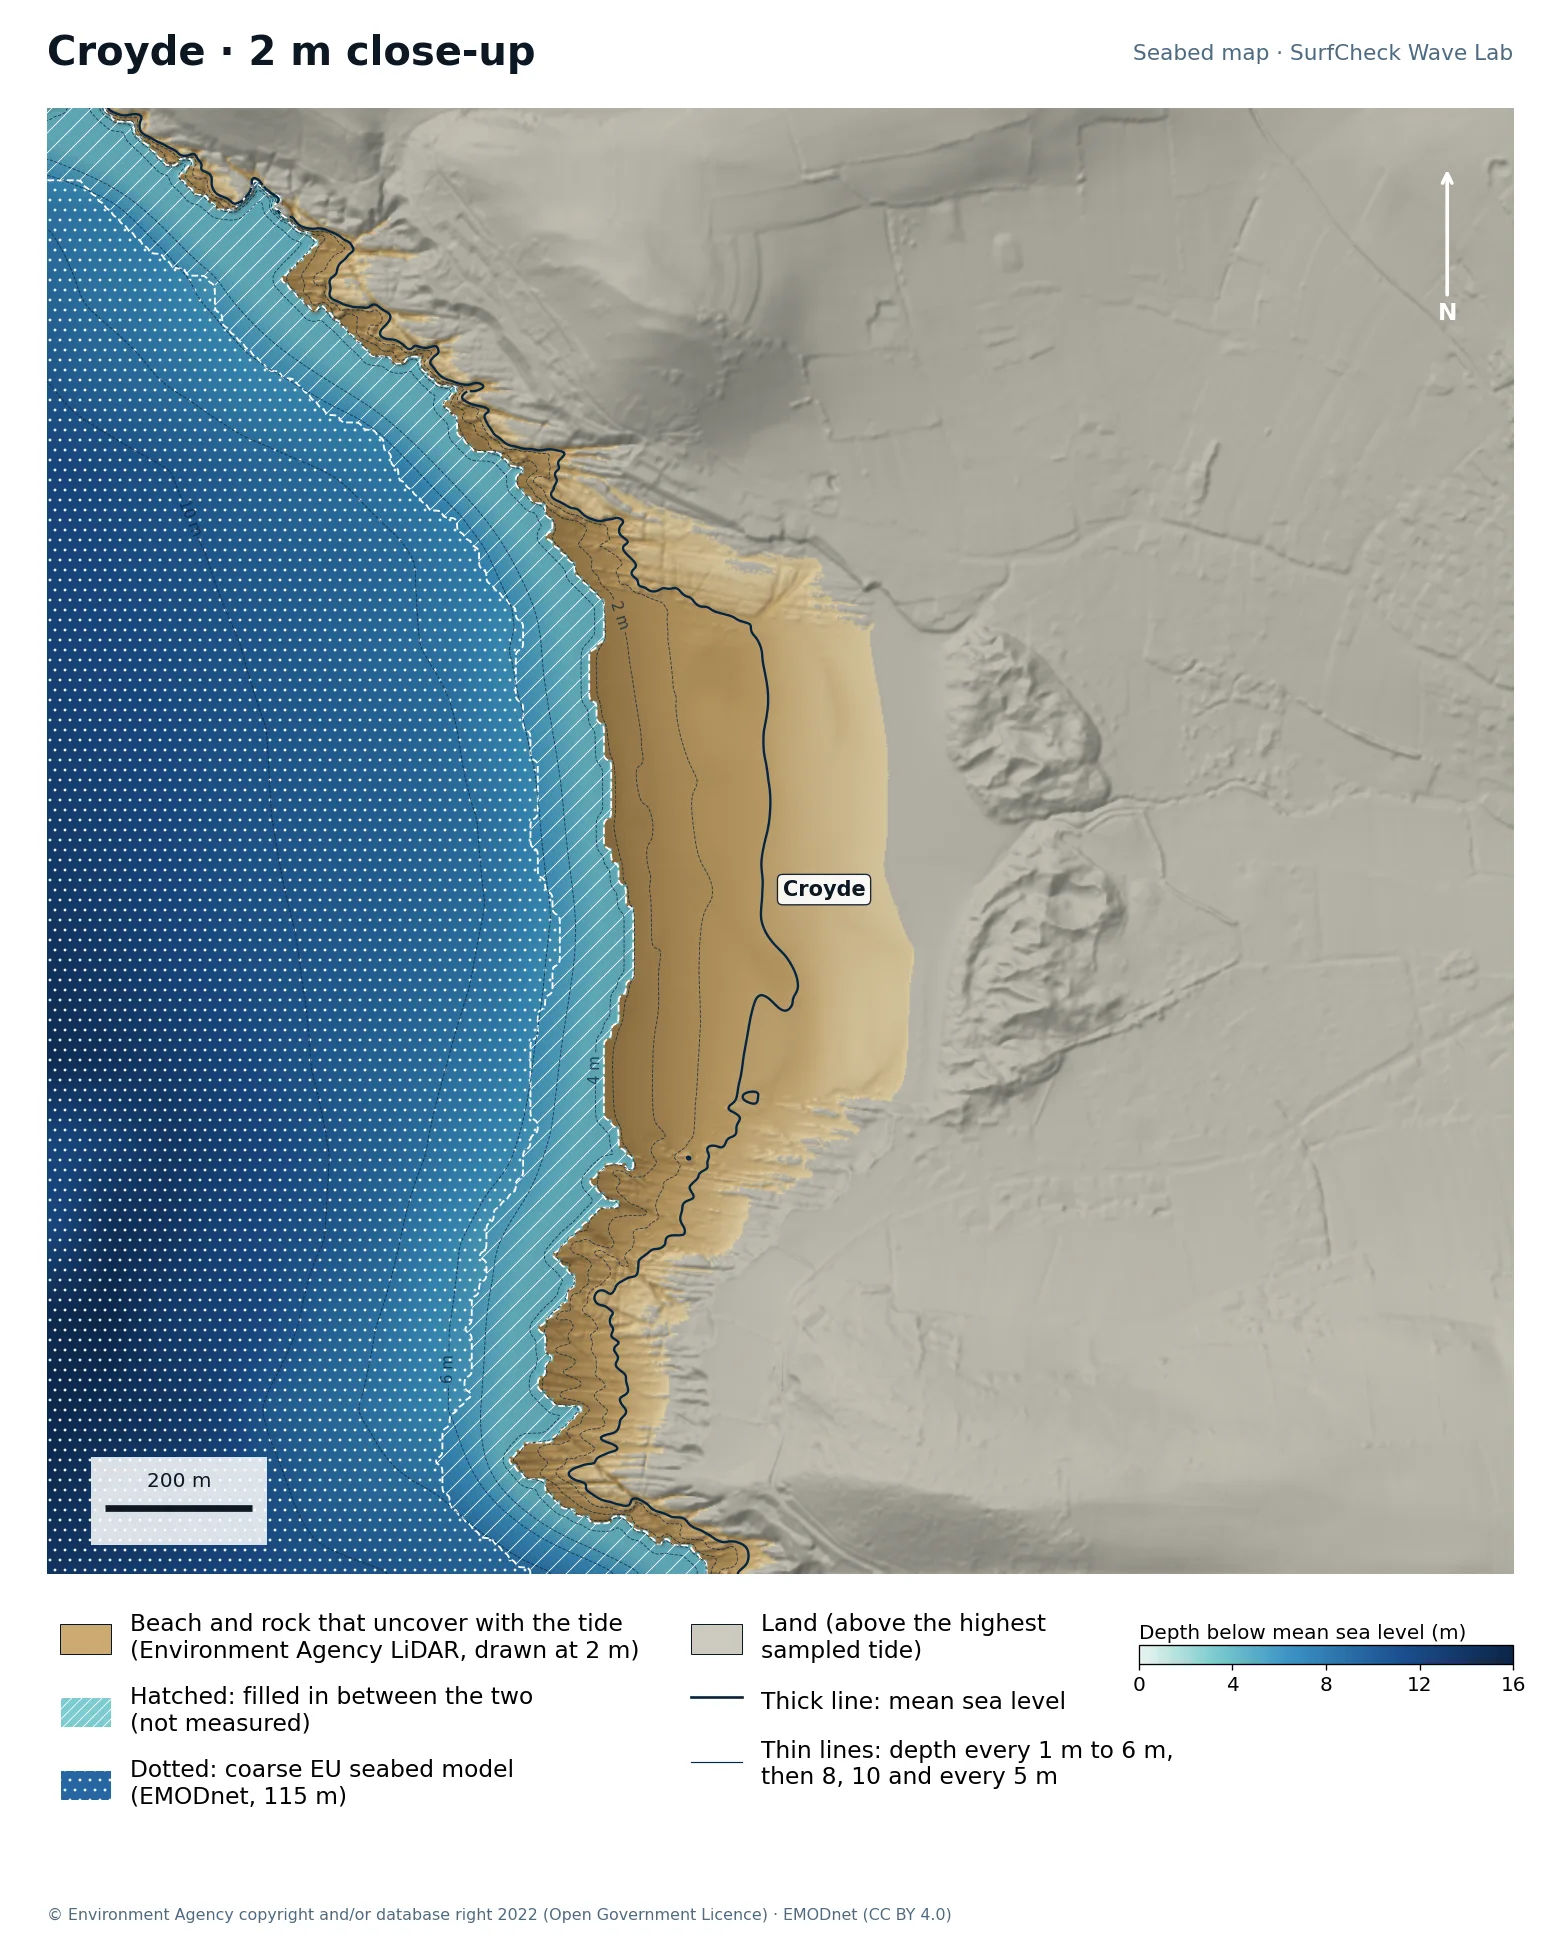
Croyde

Shore only
Seabed map of Croyde: depth contours, the reef or beach that uncovers with the tide, and which parts are measuredClose-up of Croyde in finer detail from LiDAR
11%
of the sea here is measured
108 ha
uncovers with the tide
1 m
LiDAR on the beach
120 m
filled-in band, typical width

What the seabed shows

A short, steep beach held between Baggy Point and Downend, with Saunton Sands beginning to the south. The headlands sit close together, which is part of why Croyde is punchier than its neighbours.

How sure we are

The whole beach down to about the lowest tide is Environment Agency 1 m airborne LiDAR, so the sand that waves break on from mid to high tide is measured. Below the lowest tide a band typically 120 m wide is filled in out to the coarse EU model. A 2 m boat survey by the UK Hydrographic Office covers this coast and would close that gap; it is not in this map yet. Part of Saunton was under water when it was flown, so the lower beach there is filled in.

In the Wave Lab

Swell direction is too close to call: the model cannot separate directions that differ by less than about 30% in breaker size. Breakers are about 10% bigger at high tide than at low.

Forecast and tides Run it in the Wave Lab

Cornwall · Long open beach break

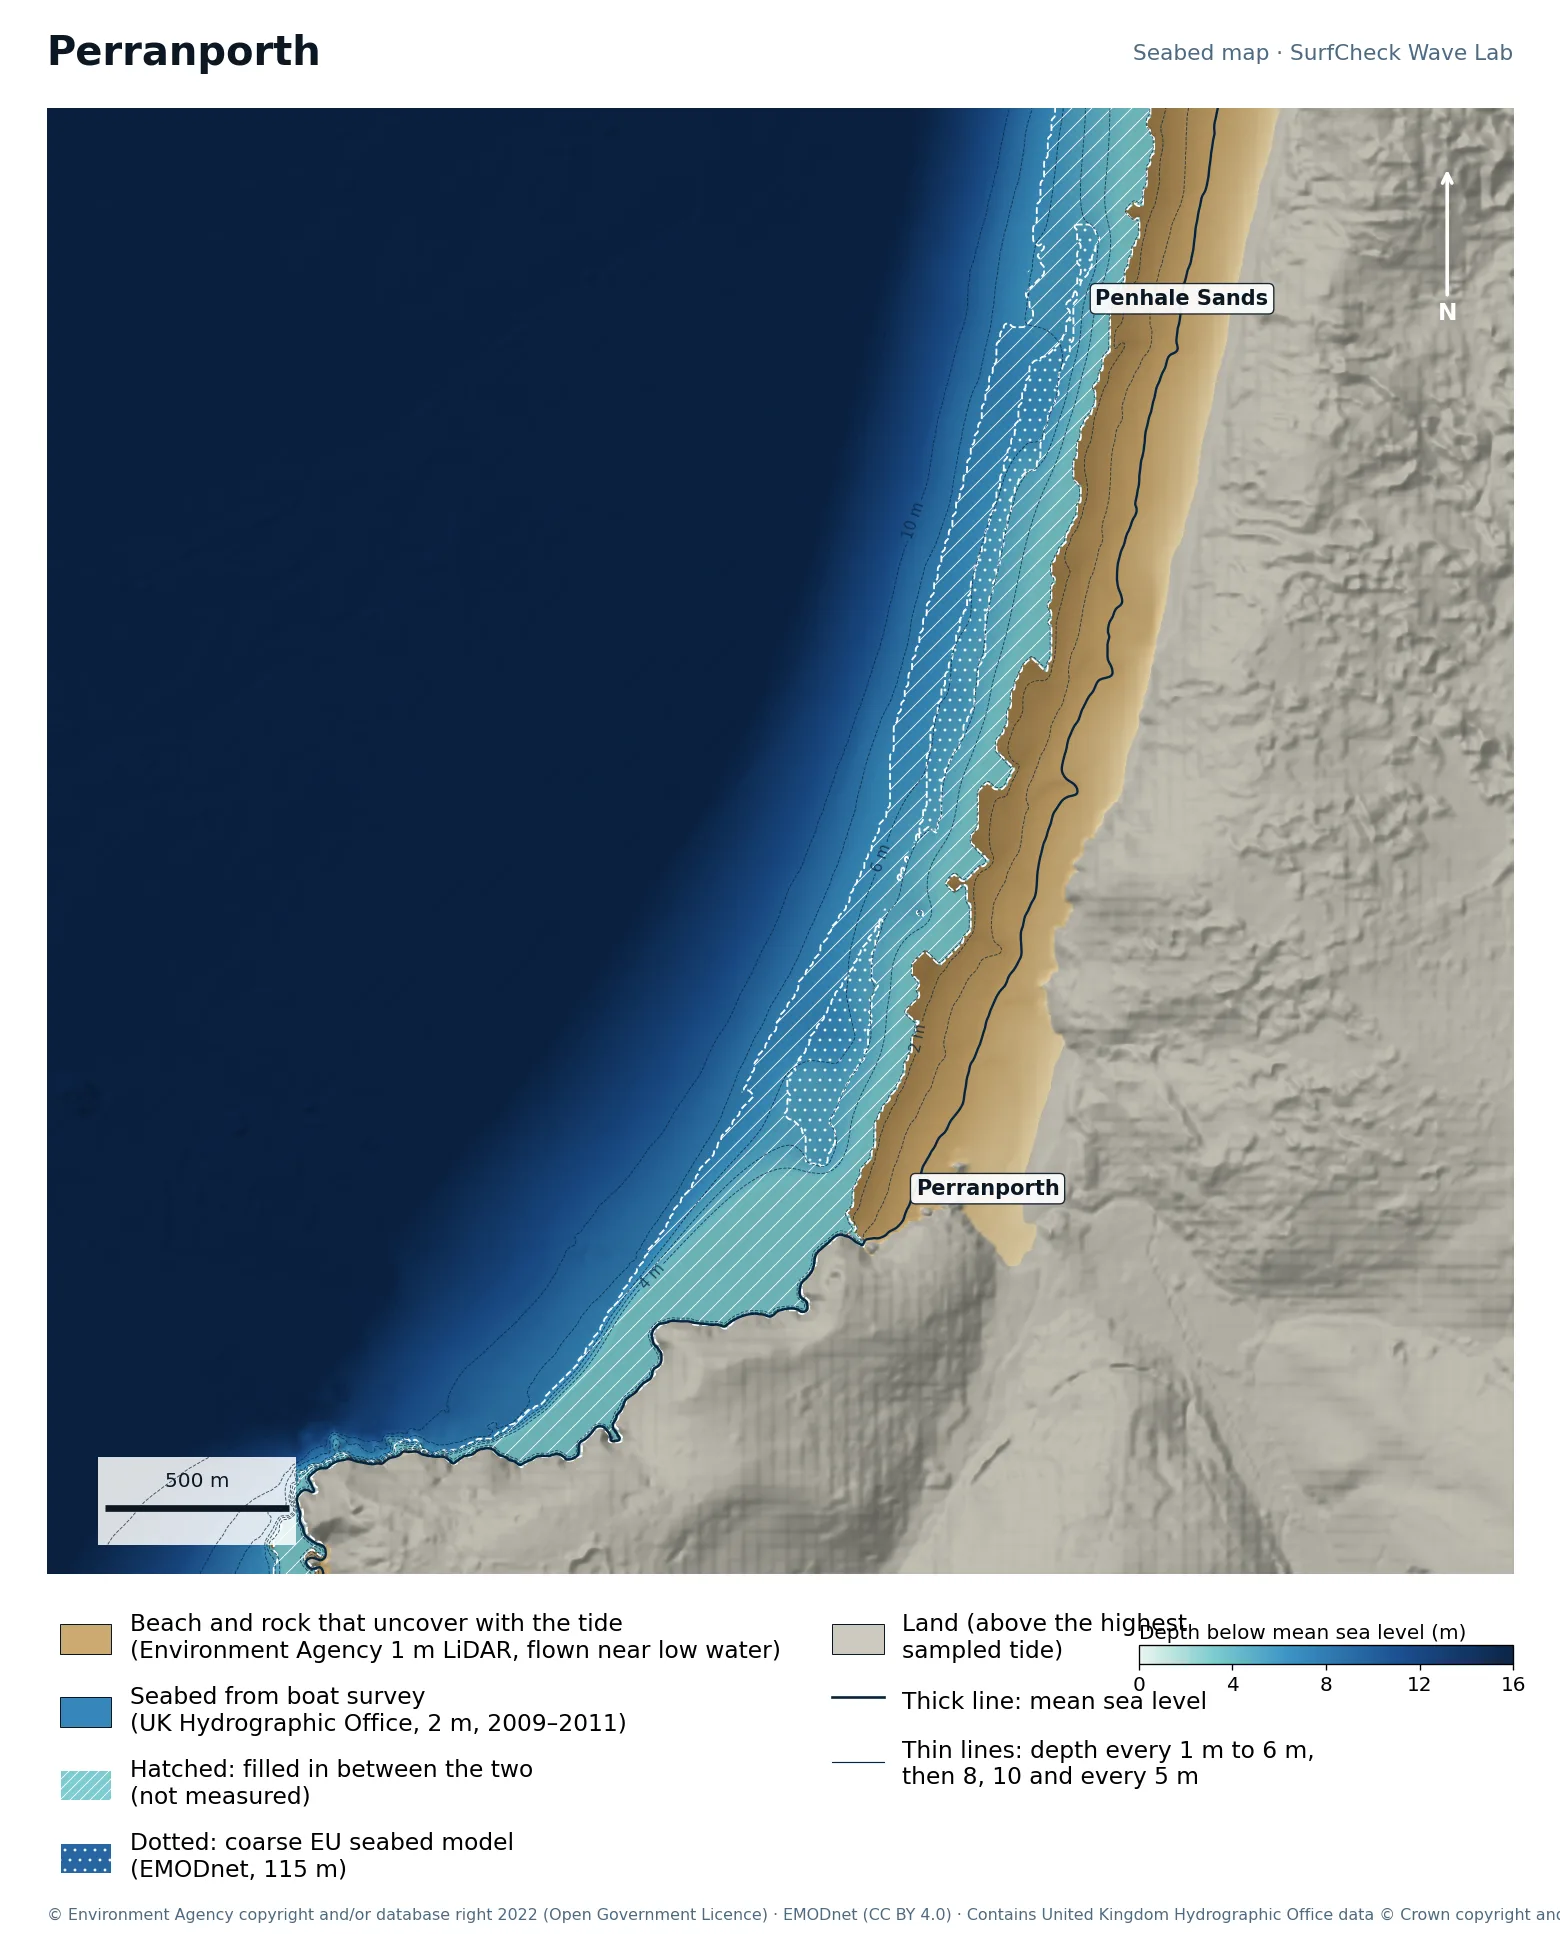
Perranporth

Well measured
Seabed map of Perranporth: depth contours, the reef or beach that uncovers with the tide, and which parts are measured
88%
of the sea here is measured
106 ha
uncovers with the tide
1 m
LiDAR on the beach
240 m
filled-in band, typical width

What the seabed shows

Three kilometres of sand running north from Perranporth into Penhale Sands, facing west-north-west with almost no shelter. The beach is wide and flat; the bars on it move constantly.

How sure we are

88% of the sea here is measured. The beach is Environment Agency 1 m airborne LiDAR and the seabed beyond is a UK Hydrographic Office 2 m boat survey (2009 to 2011). A band about 240 m wide between them is filled in. Sand moves, so the bars are as surveyed.

In the Wave Lab

Swell direction is too close to call: the model cannot separate directions that differ by less than about 30% in breaker size. Breakers are about 16% bigger at high tide than at low.

Forecast and tides Run it in the Wave Lab

Cornwall · Open beach under cliffs

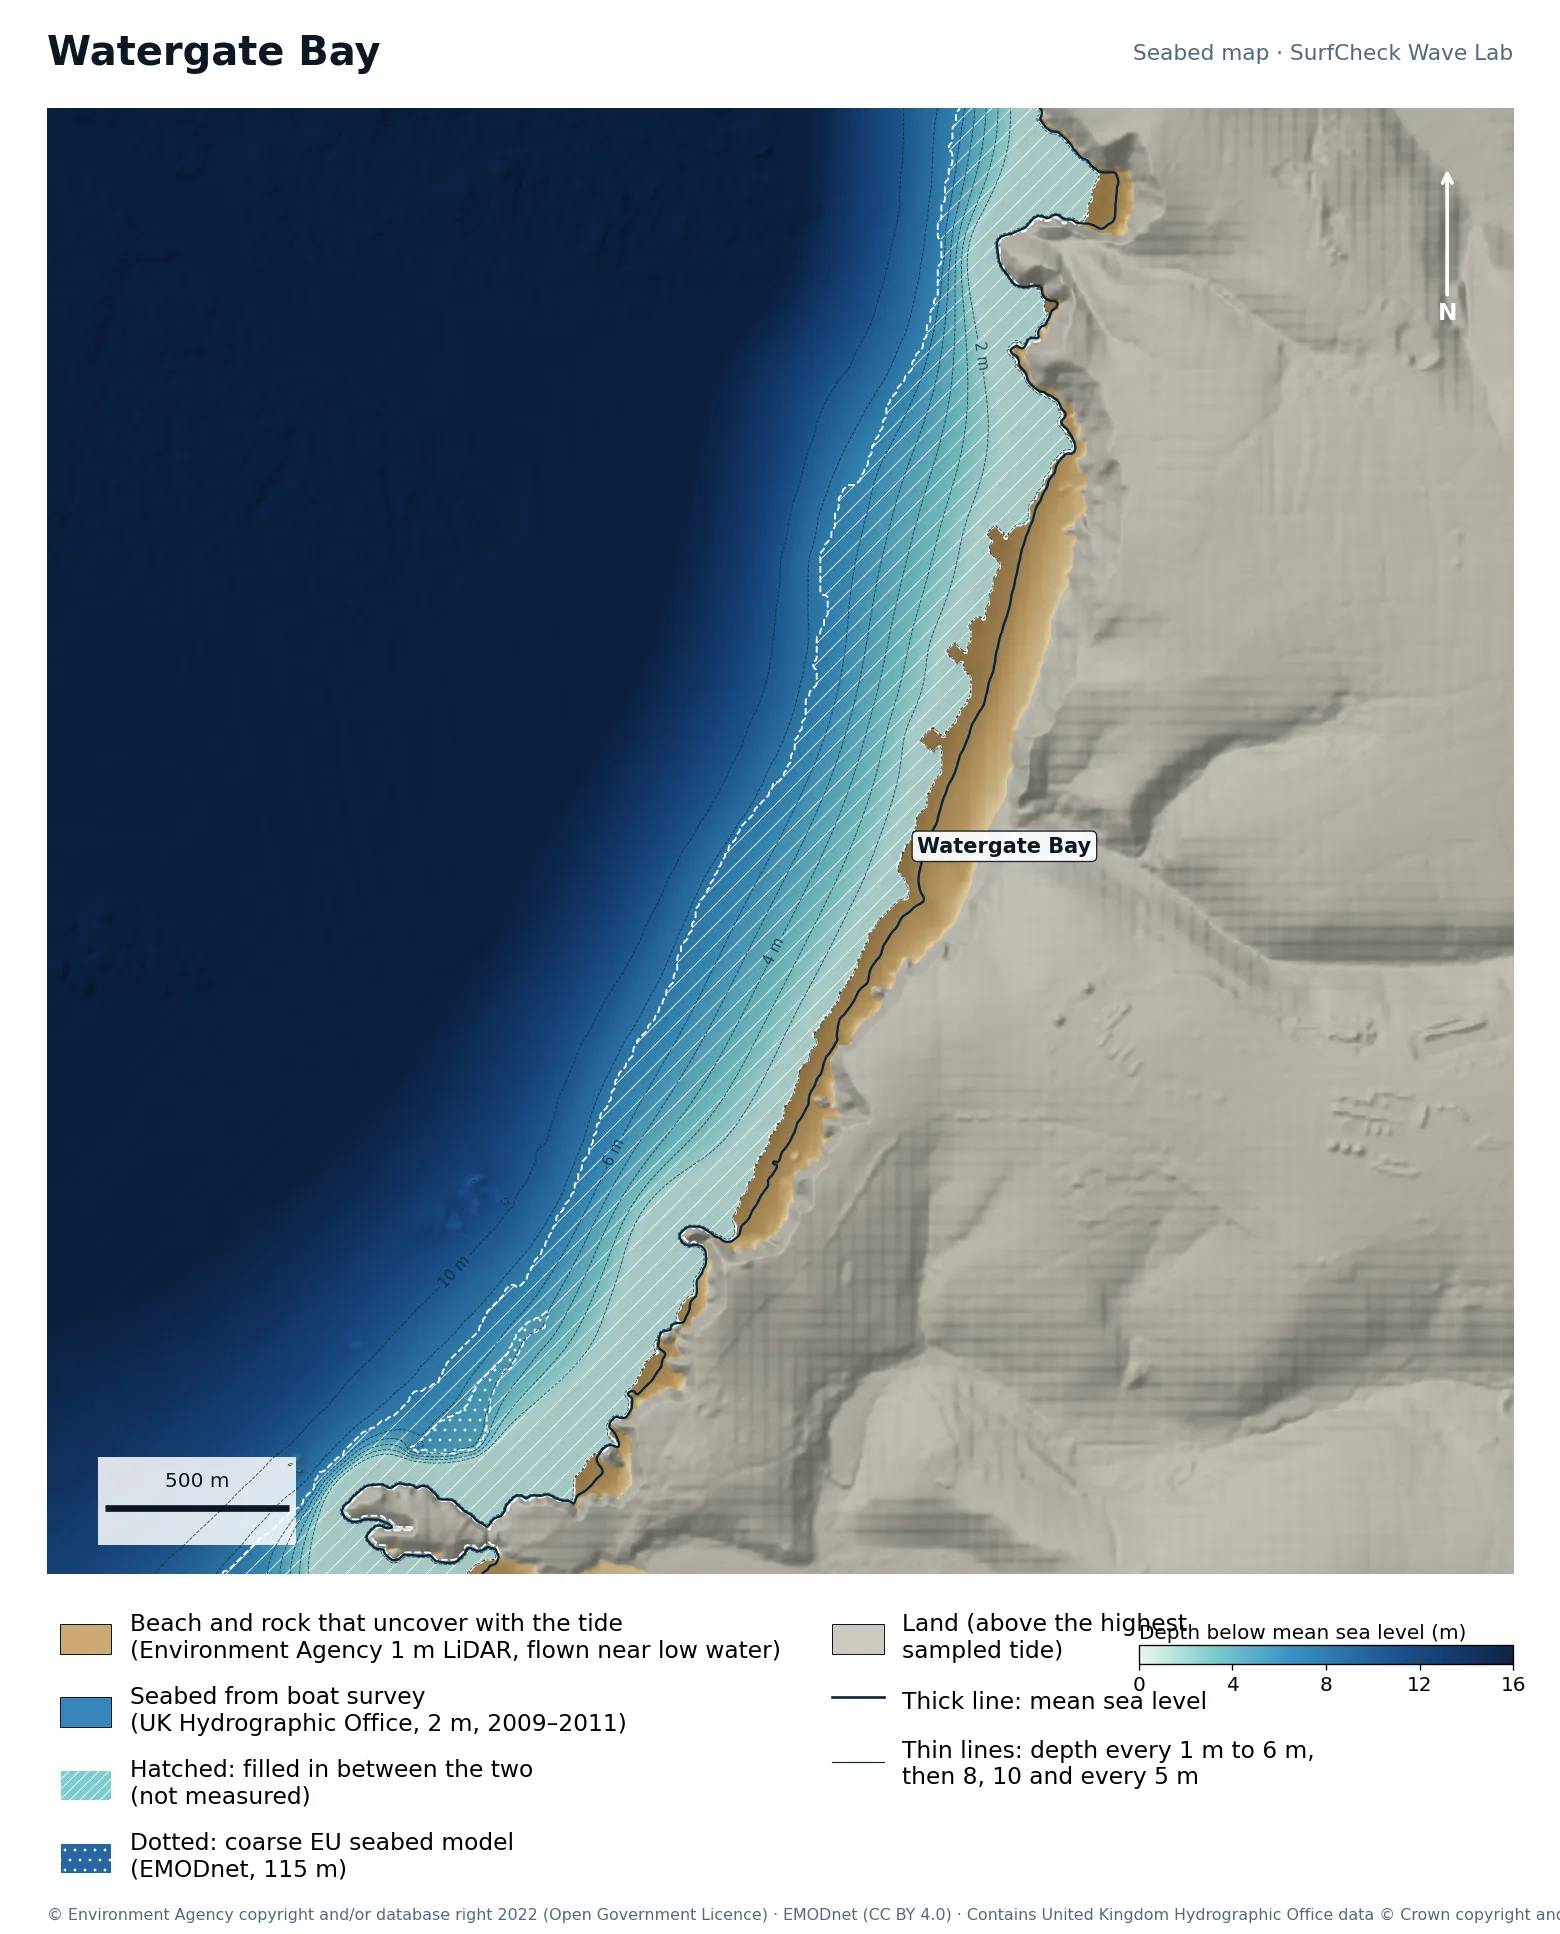
Watergate Bay

Well measured
Seabed map of Watergate Bay: depth contours, the reef or beach that uncovers with the tide, and which parts are measured
81%
of the sea here is measured
46 ha
uncovers with the tide
1 m
LiDAR on the beach
350 m
filled-in band, typical width

What the seabed shows

Three kilometres of sand backed by cliffs, facing west-north-west. Nothing shelters it, so it takes most Atlantic swell.

How sure we are

81% of the sea here is measured. The beach is Environment Agency 1 m airborne LiDAR and the seabed beyond is a UK Hydrographic Office 2 m boat survey (2009 to 2011). A band about 350 m wide between them is filled in. Sand moves, so the bars are as surveyed. The LiDAR here was flown at about mid tide, which is why the filled-in band is wider.

In the Wave Lab

Low confidence, because the seabed under the break is not measured. Swell direction is too close to call: the model cannot separate directions that differ by less than about 30% in breaker size. Tide changes breaker size by under 4%.

Forecast and tides Run it in the Wave Lab

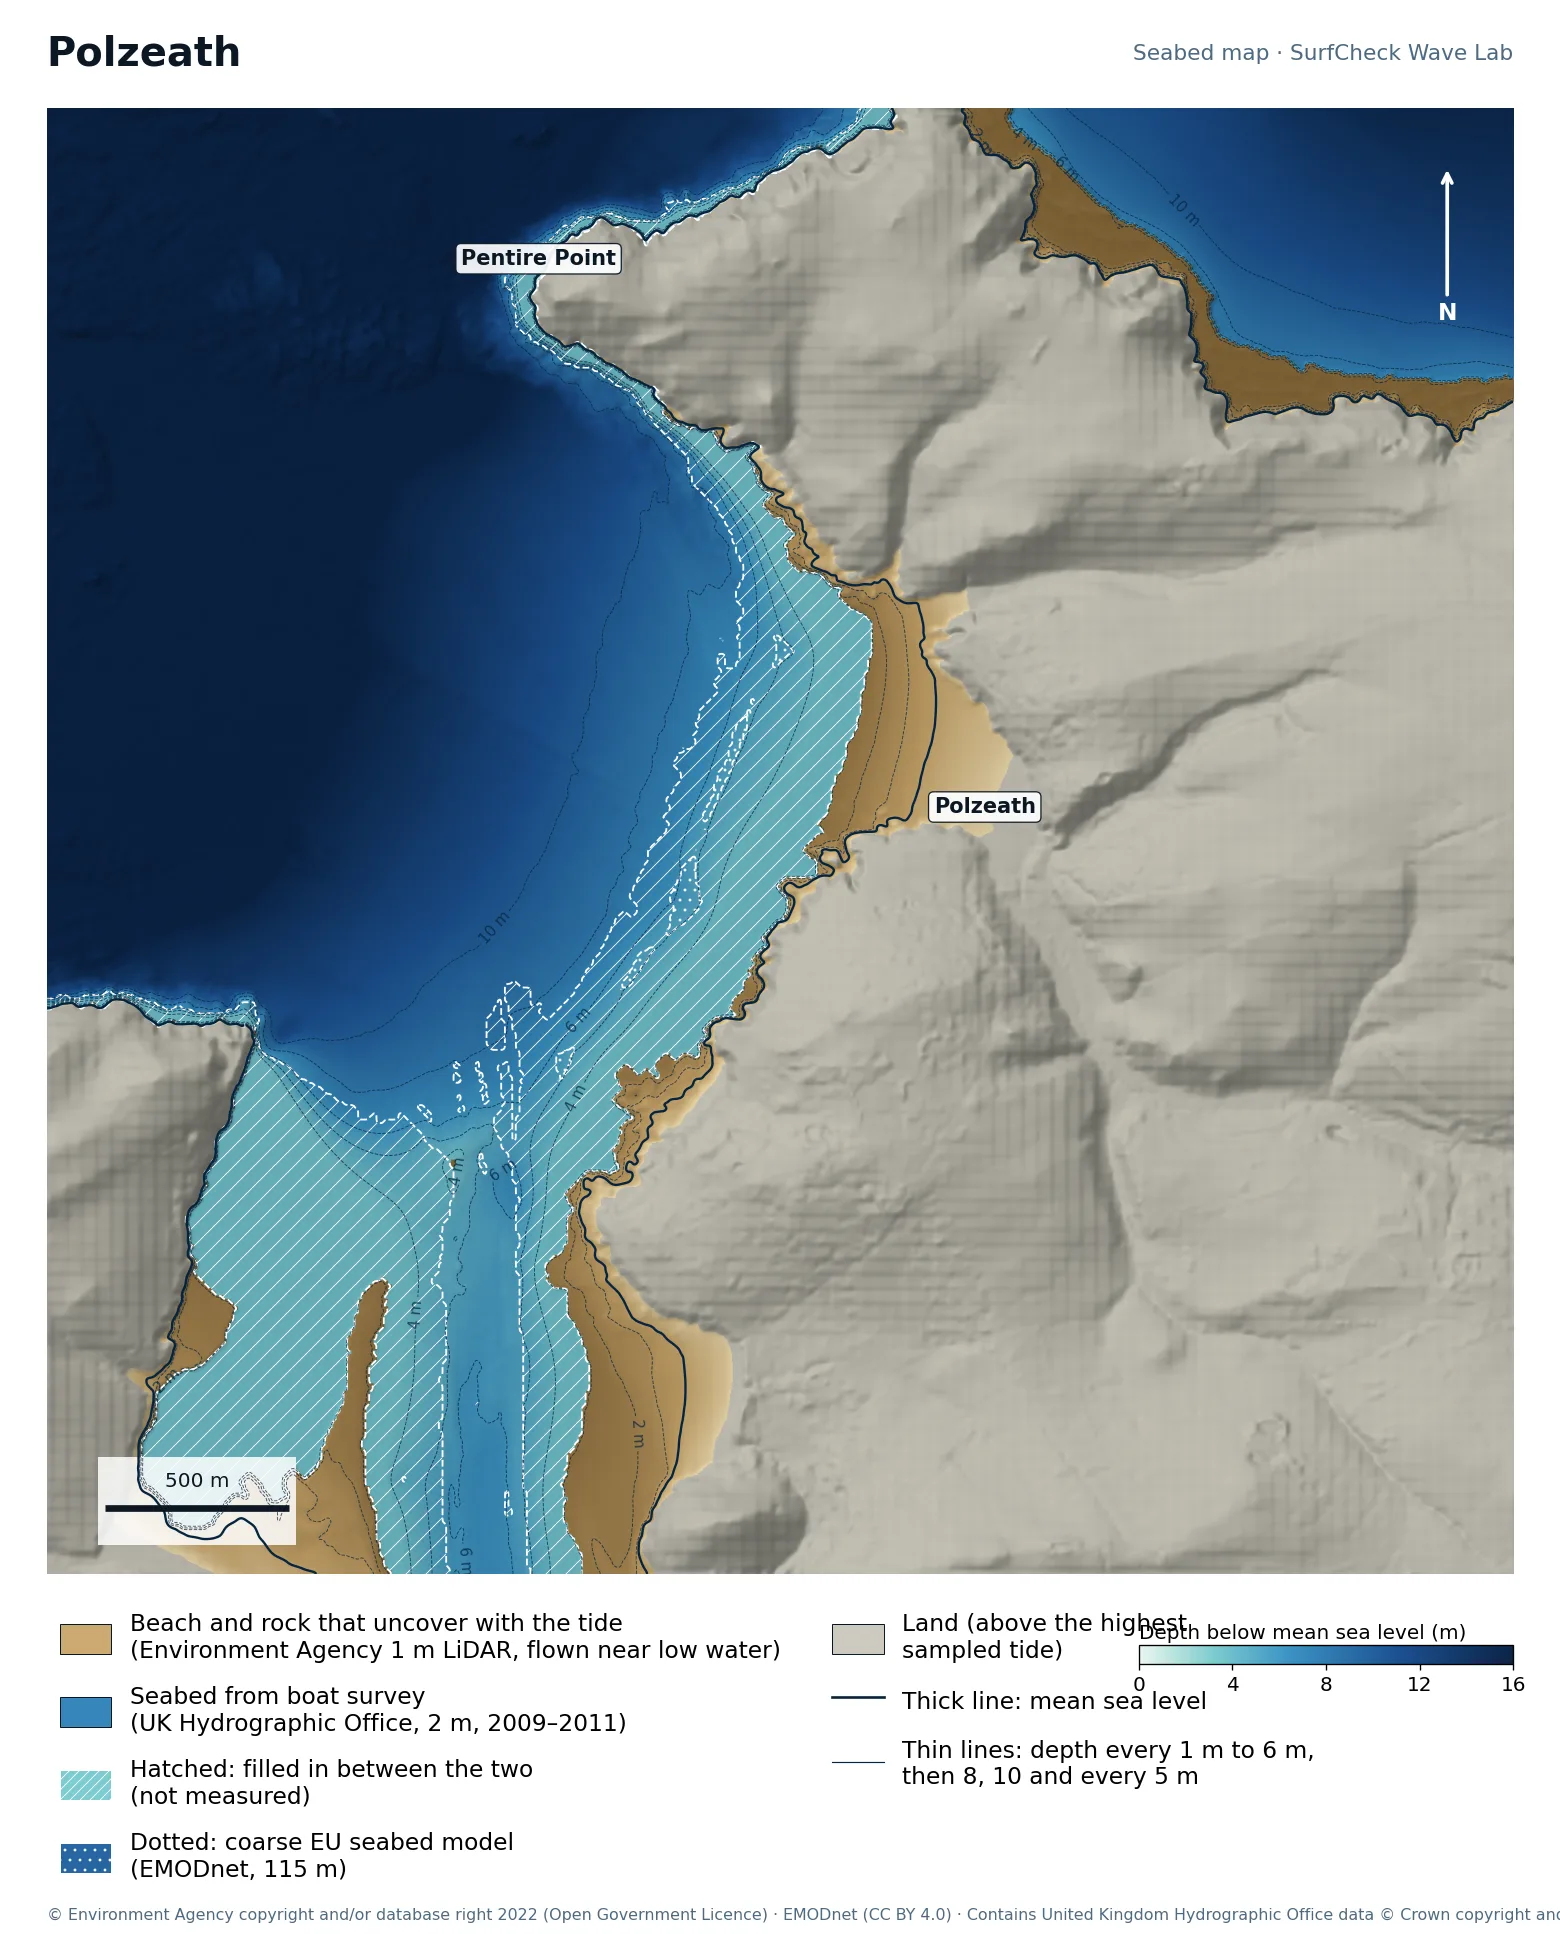
Cornwall · Sheltered beach inside a headland

Polzeath

Well measured
Seabed map of Polzeath: depth contours, the reef or beach that uncovers with the tide, and which parts are measured
79%
of the sea here is measured
111 ha
uncovers with the tide
1 m
LiDAR on the beach
200 m
filled-in band, typical width

What the seabed shows

A wide, flat beach at the mouth of the Camel estuary, tucked inside Pentire Point. The map also shows the Doom Bar side of the estuary to the south-west.

How sure we are

79% of the sea here is measured. The beach is Environment Agency 1 m airborne LiDAR and the seabed beyond is a UK Hydrographic Office 2 m boat survey (2009 to 2011). A band about 200 m wide between them is filled in. Sand moves, so the bars are as surveyed. Sea-surface patches in the LiDAR were removed by checking them against the boat survey.

In the Wave Lab

Swell direction is too close to call: the model cannot separate directions that differ by less than about 30% in breaker size. Breakers are about 6% bigger at high tide than at low.

Forecast and tides Run it in the Wave Lab

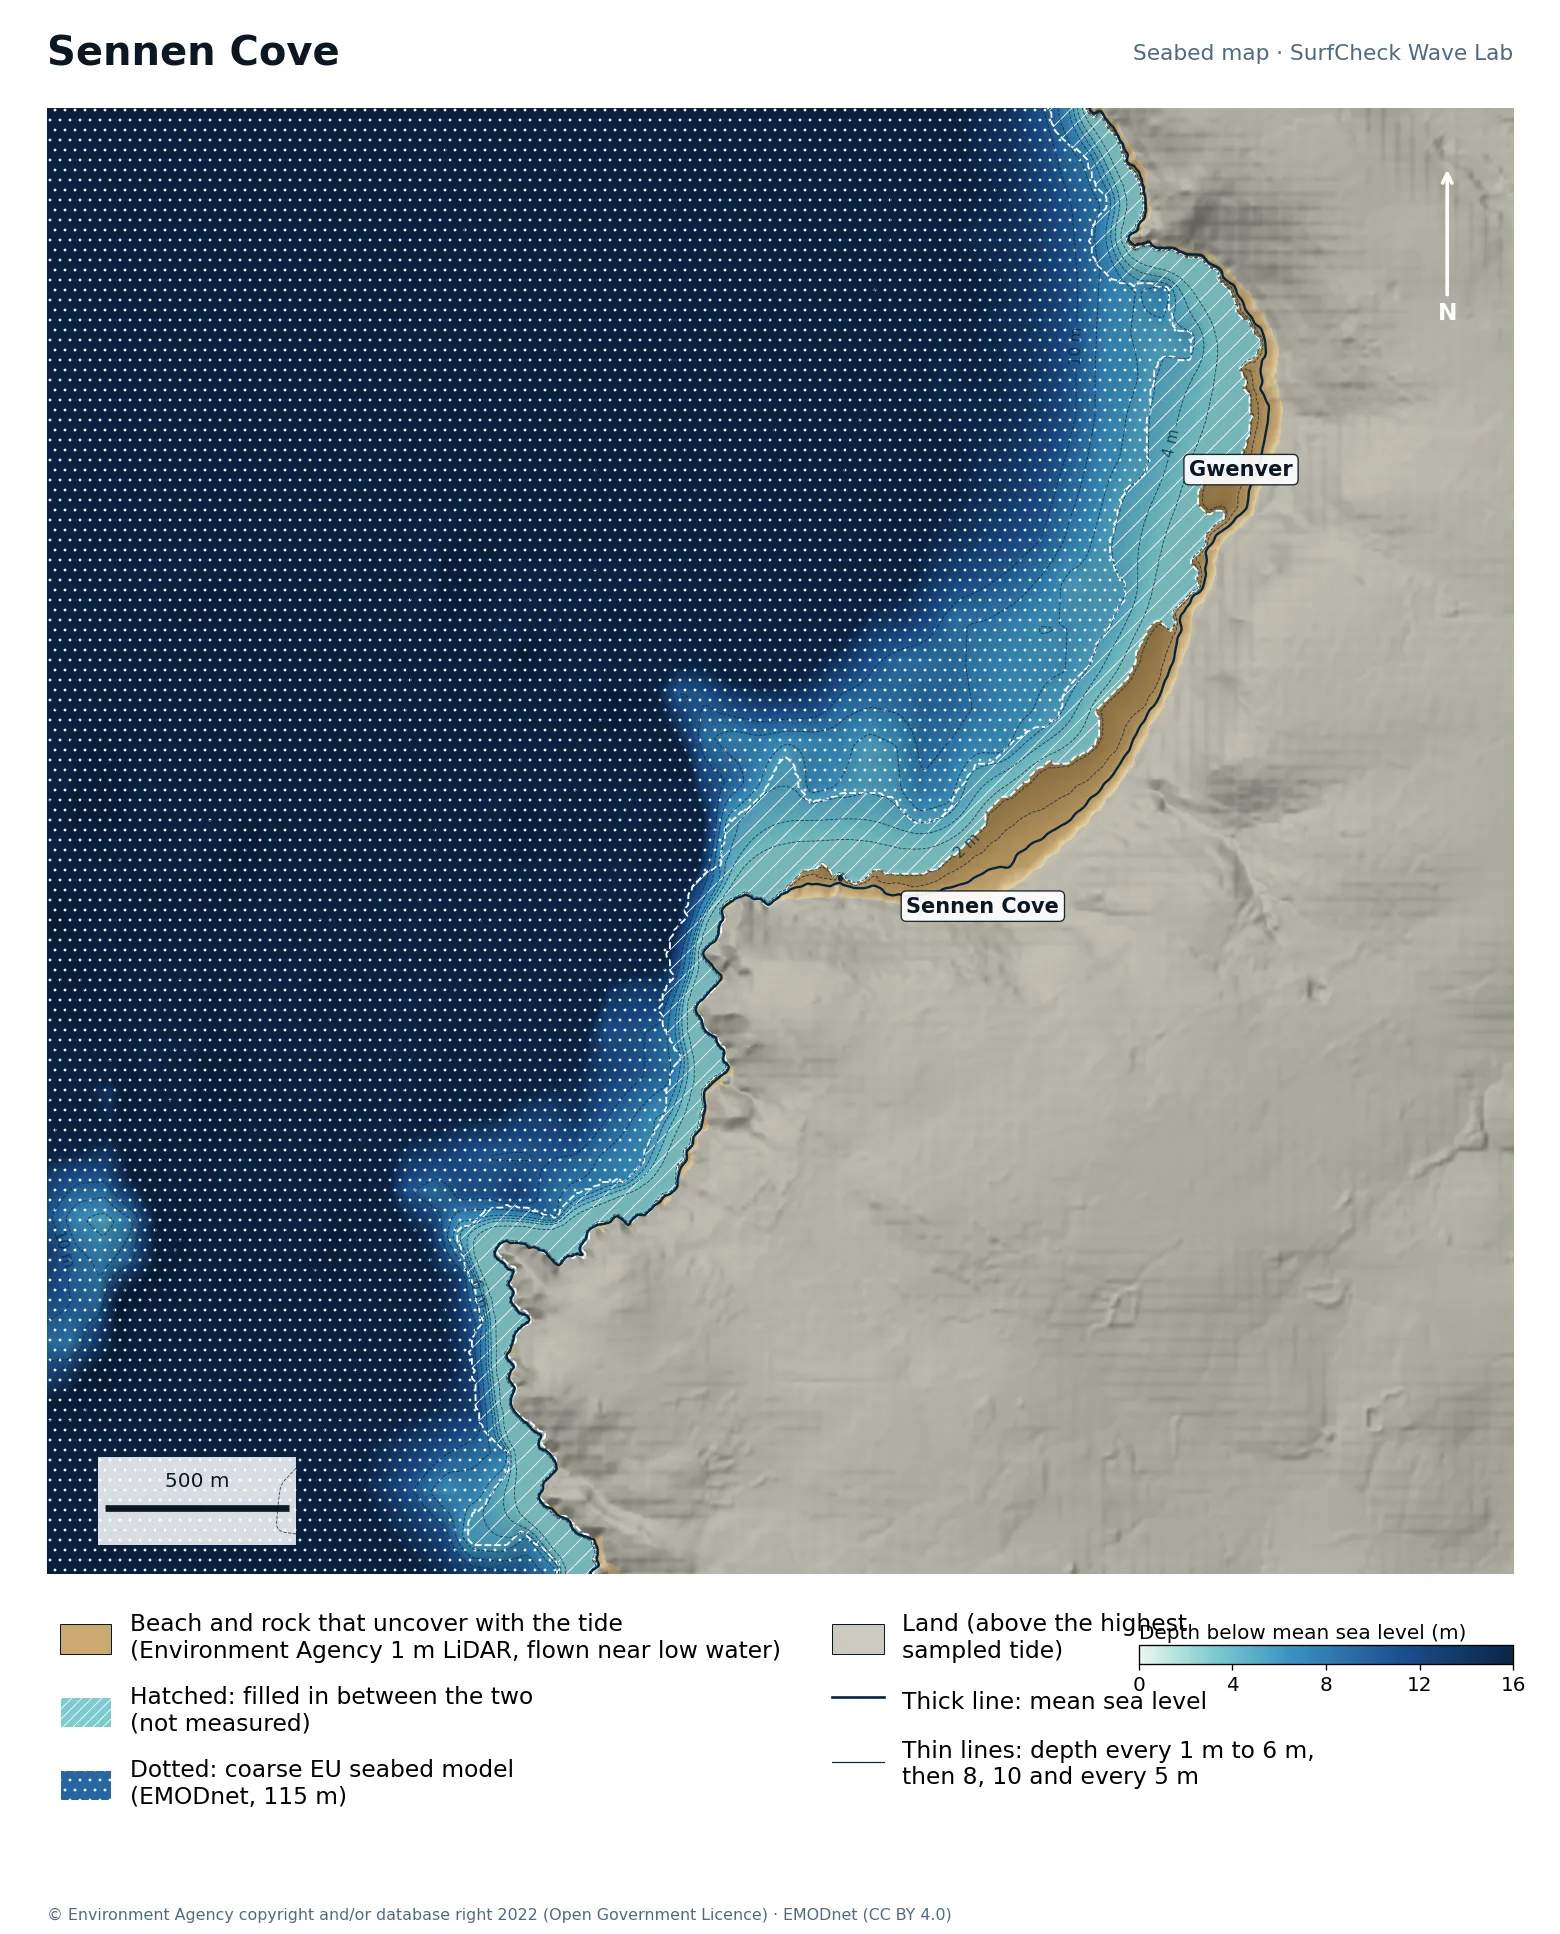
Cornwall · Exposed beach near Land’s End

Sennen Cove

Shore only
Seabed map of Sennen Cove: depth contours, the reef or beach that uncovers with the tide, and which parts are measured
3%
of the sea here is measured
29 ha
uncovers with the tide
1 m
LiDAR on the beach
170 m
filled-in band, typical width

What the seabed shows

Whitesand Bay curves north from the harbour at Sennen Cove to Gwenver. The beach is narrow and fairly steep, and deep water comes close in.

How sure we are

The beach down to the water level on the day it was flown is Environment Agency 1 m airborne LiDAR. Below that a band about 170 m wide is filled in out to the coarse EU model. The measured strip is narrow here, so at most tides the waves break seaward of it.

In the Wave Lab

Low confidence, because the seabed under the break is not measured. Swell direction is too close to call: the model cannot separate directions that differ by less than about 30% in breaker size. Breakers are about 36% bigger at high tide than at low.

Forecast and tides Run it in the Wave Lab

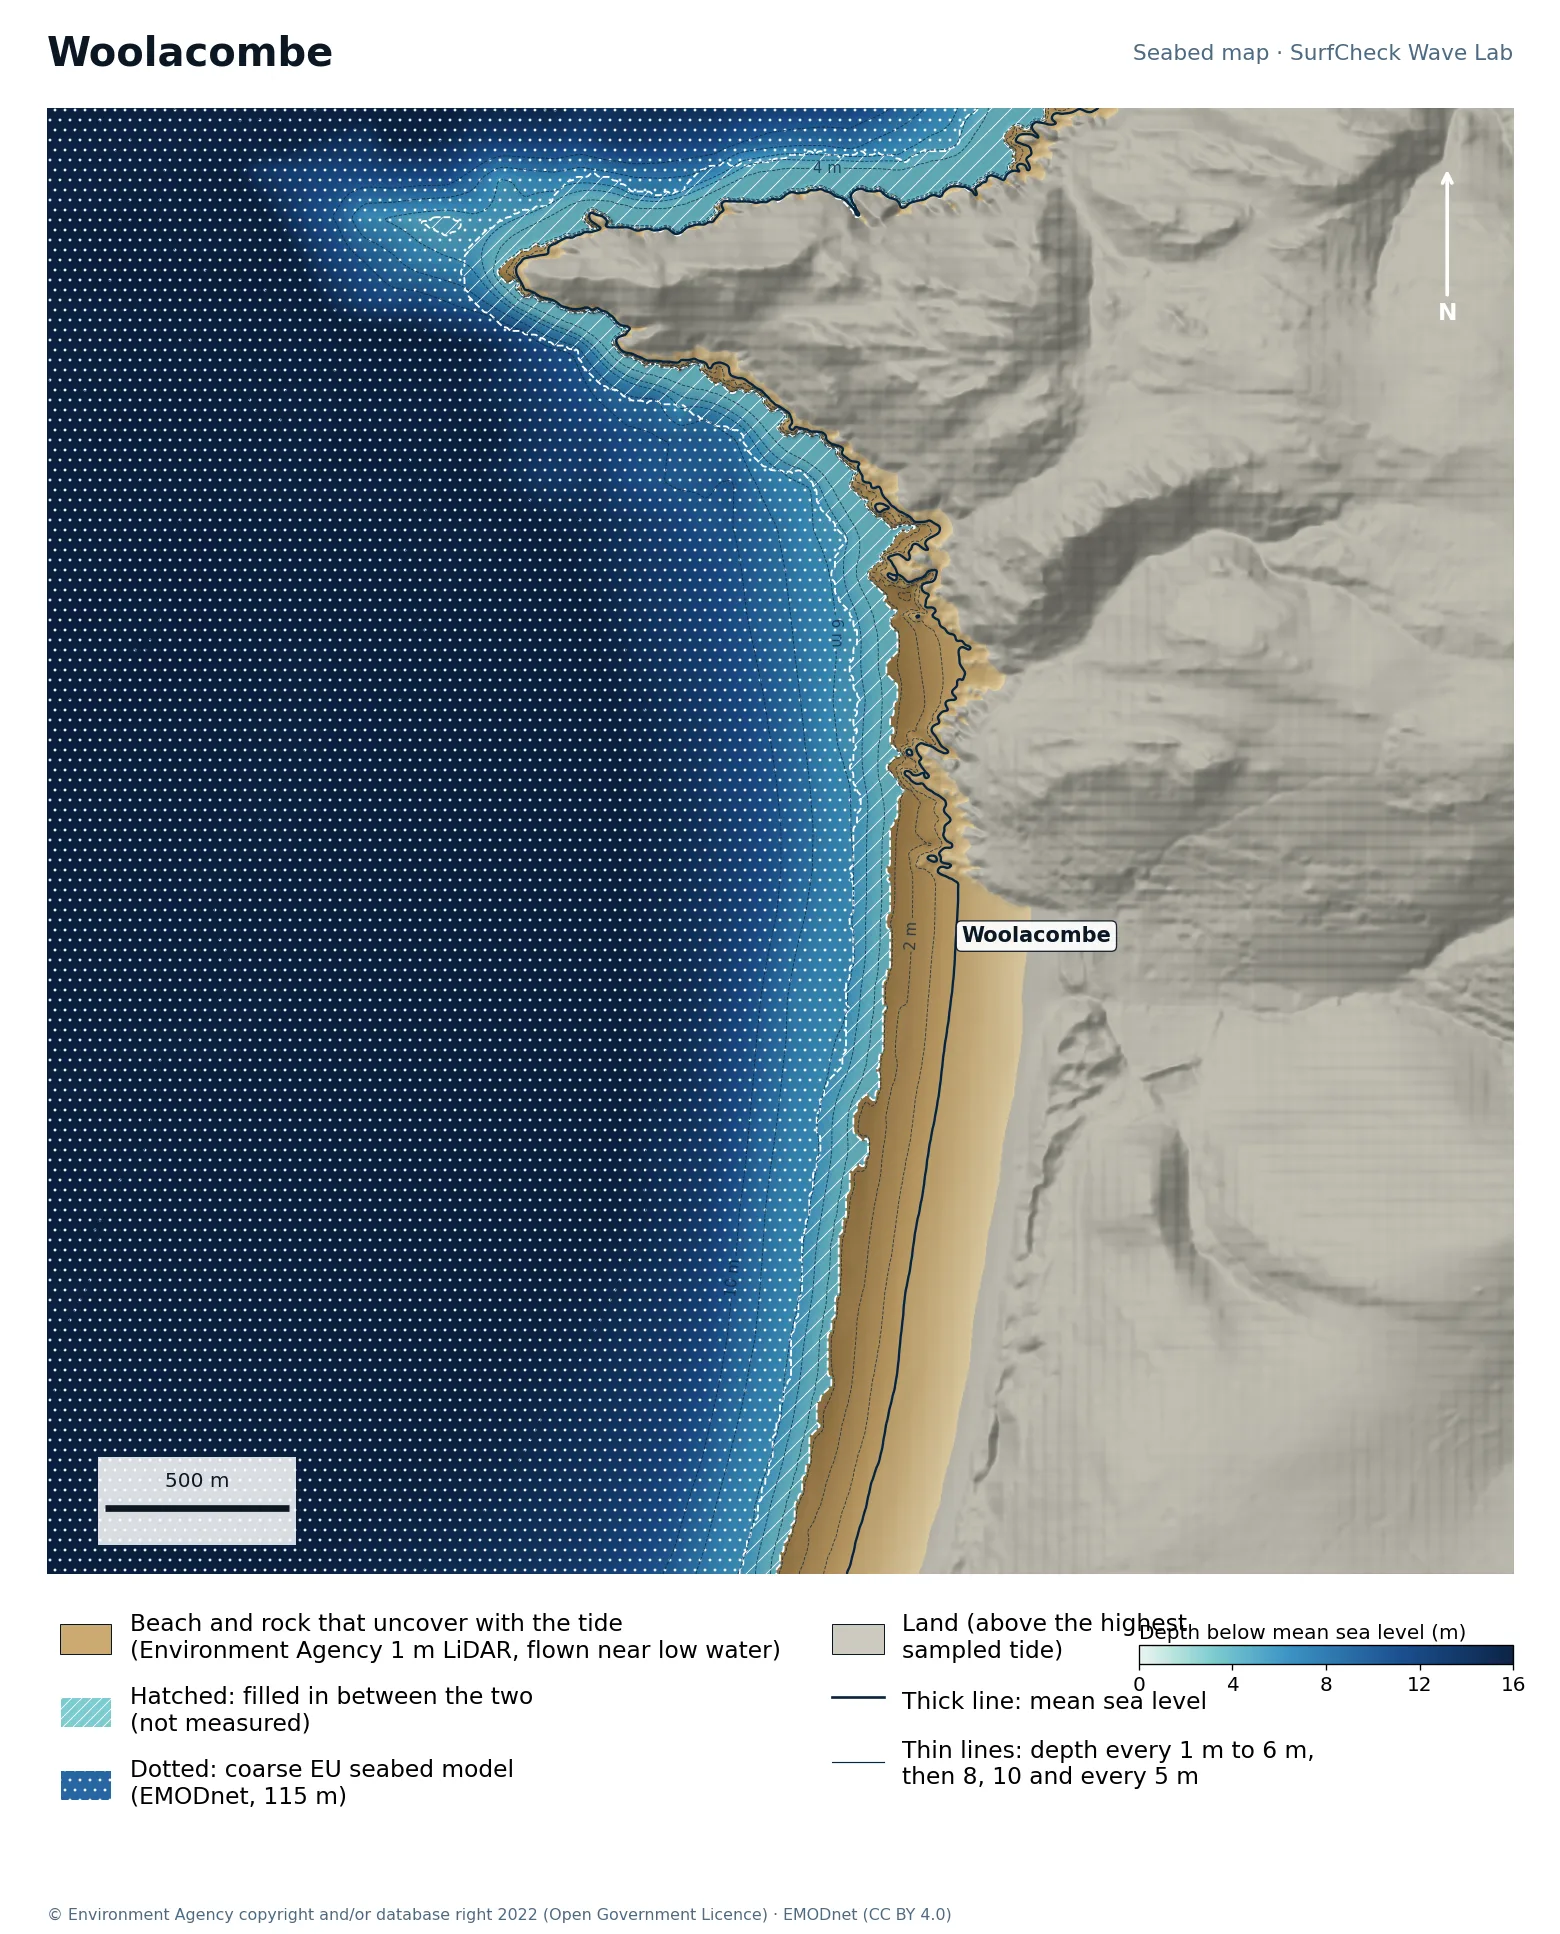
North Devon · Long, even beach

Woolacombe

Shore only
Seabed map of Woolacombe: depth contours, the reef or beach that uncovers with the tide, and which parts are measured
11%
of the sea here is measured
102 ha
uncovers with the tide
1 m
LiDAR on the beach
100 m
filled-in band, typical width

What the seabed shows

Three kilometres of sand between Morte Point and Baggy Point, running south to Putsborough. The contours are close to straight and parallel, which is what an even beach break looks like from above.

How sure we are

The beach down to the water level on the day it was flown is Environment Agency 1 m airborne LiDAR. Below that a band about 100 m wide is filled in out to the coarse EU model.

In the Wave Lab

Swell direction is too close to call: the model cannot separate directions that differ by less than about 30% in breaker size. Breakers are about 10% bigger at high tide than at low.

Forecast and tides Run it in the Wave Lab

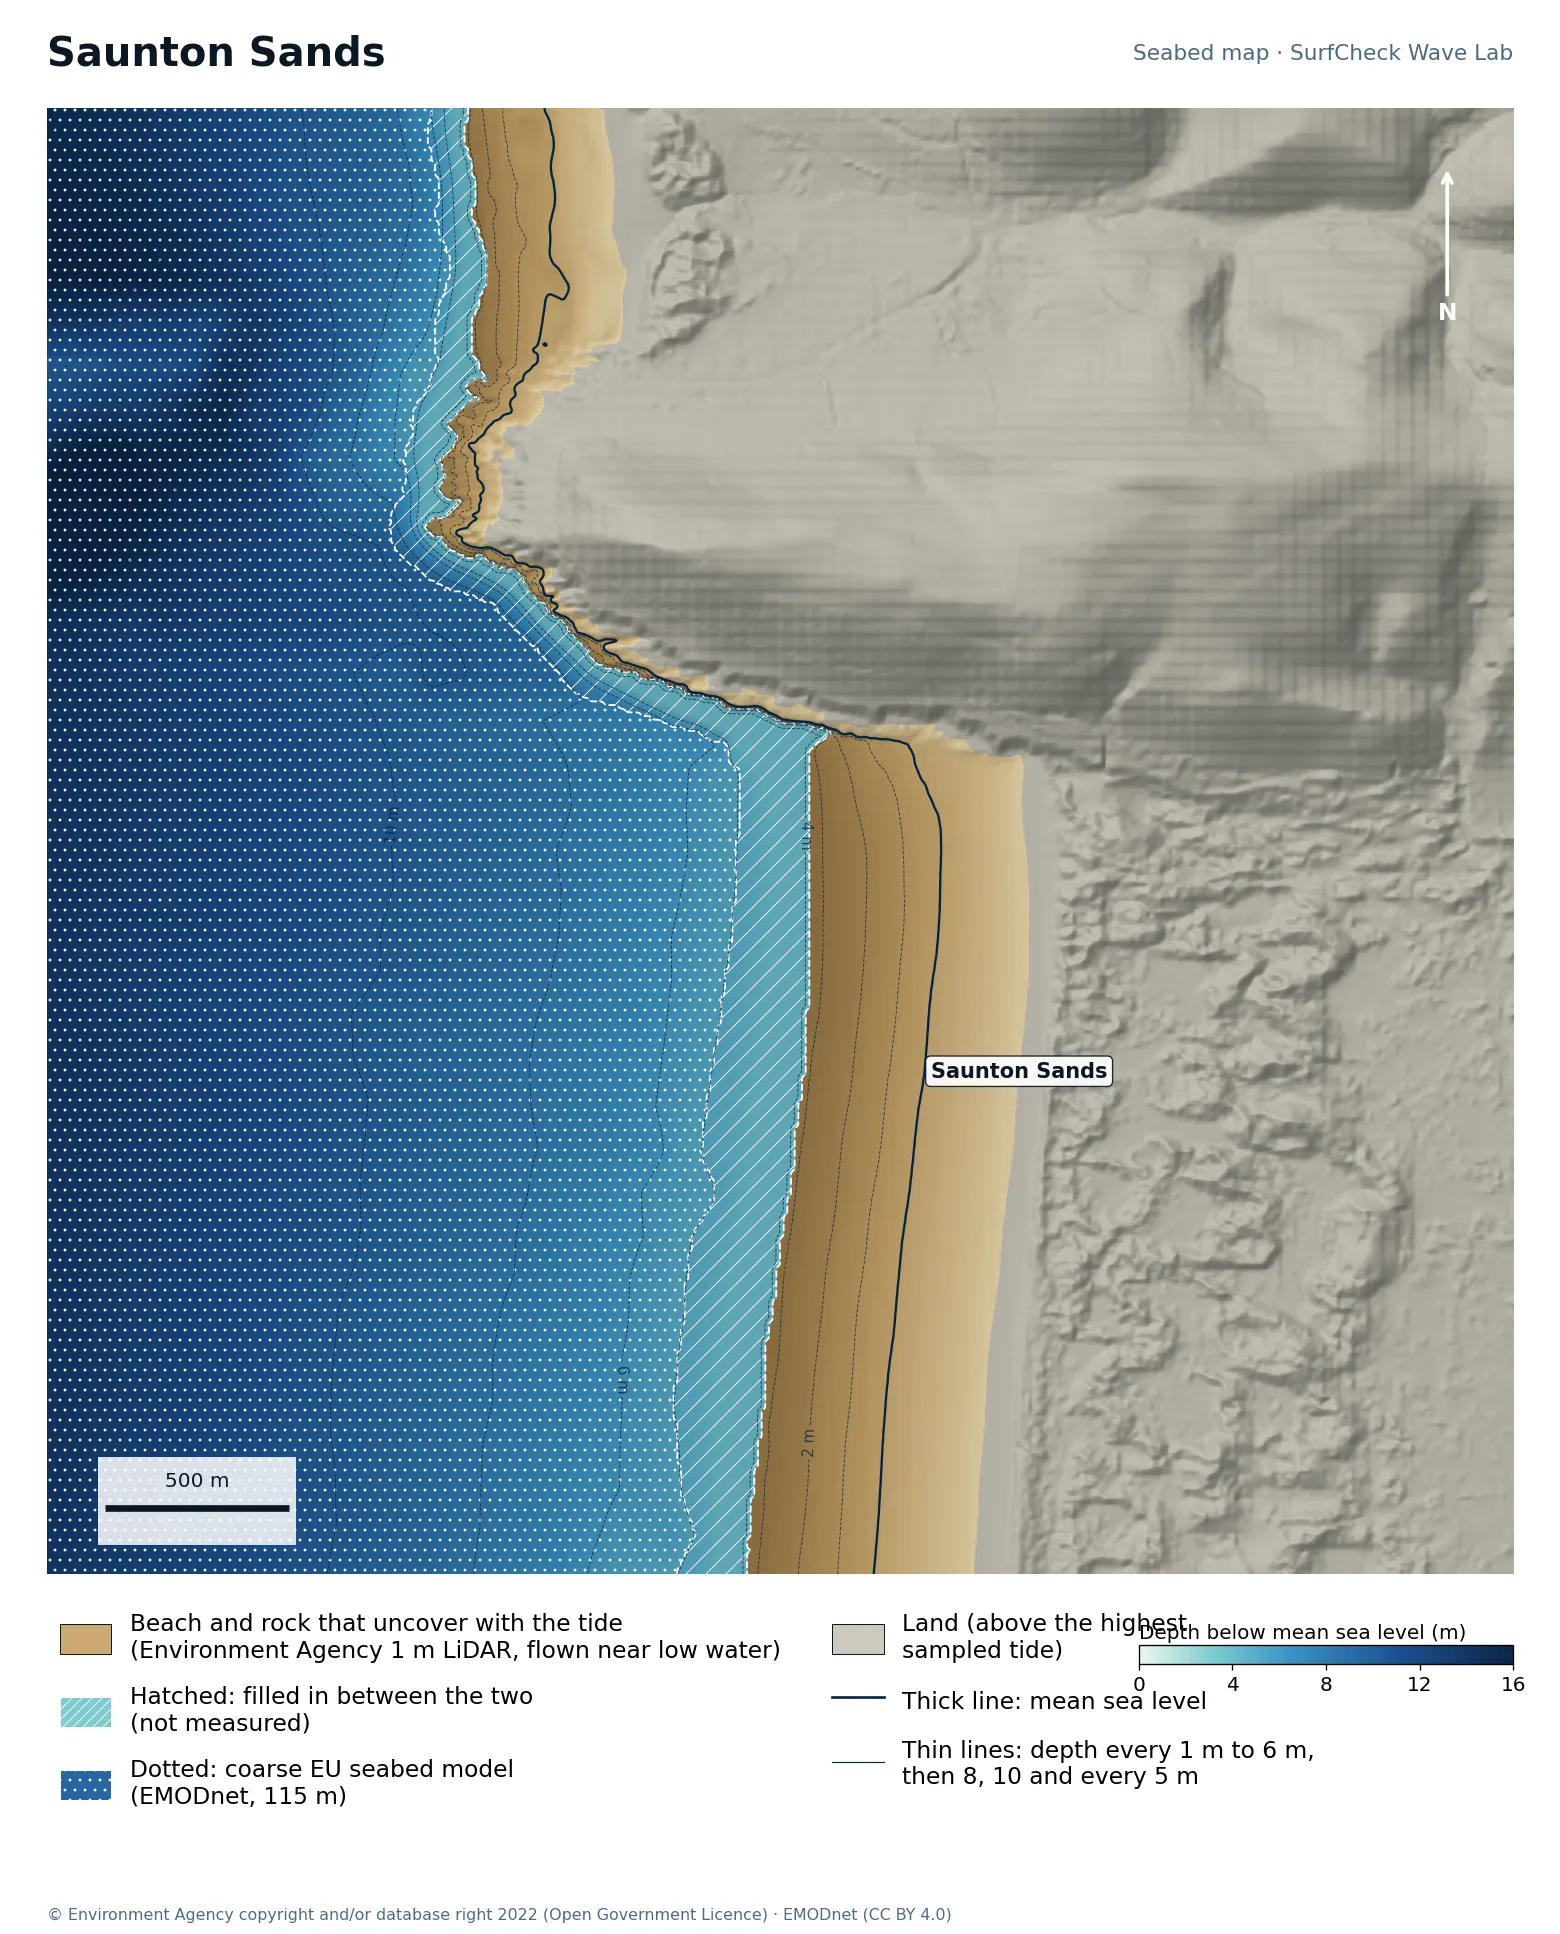
North Devon · Very flat longboard beach

Saunton Sands

Shore only
Seabed map of Saunton Sands: depth contours, the reef or beach that uncovers with the tide, and which parts are measured
21%
of the sea here is measured
178 ha
uncovers with the tide
1 m
LiDAR on the beach
160 m
filled-in band, typical width

What the seabed shows

A wide, gently shelving beach in front of Braunton Burrows, sheltered at its north end by Saunton Down.

How sure we are

The beach down to the water level on the day it was flown is Environment Agency 1 m airborne LiDAR. Below that a band about 160 m wide is filled in out to the coarse EU model.

In the Wave Lab

Swell direction is too close to call: the model cannot separate directions that differ by less than about 30% in breaker size. Breakers are about 16% bigger at high tide than at low.

Forecast and tides Run it in the Wave Lab

South Devon · River-mouth beach

Bantham

Shore only
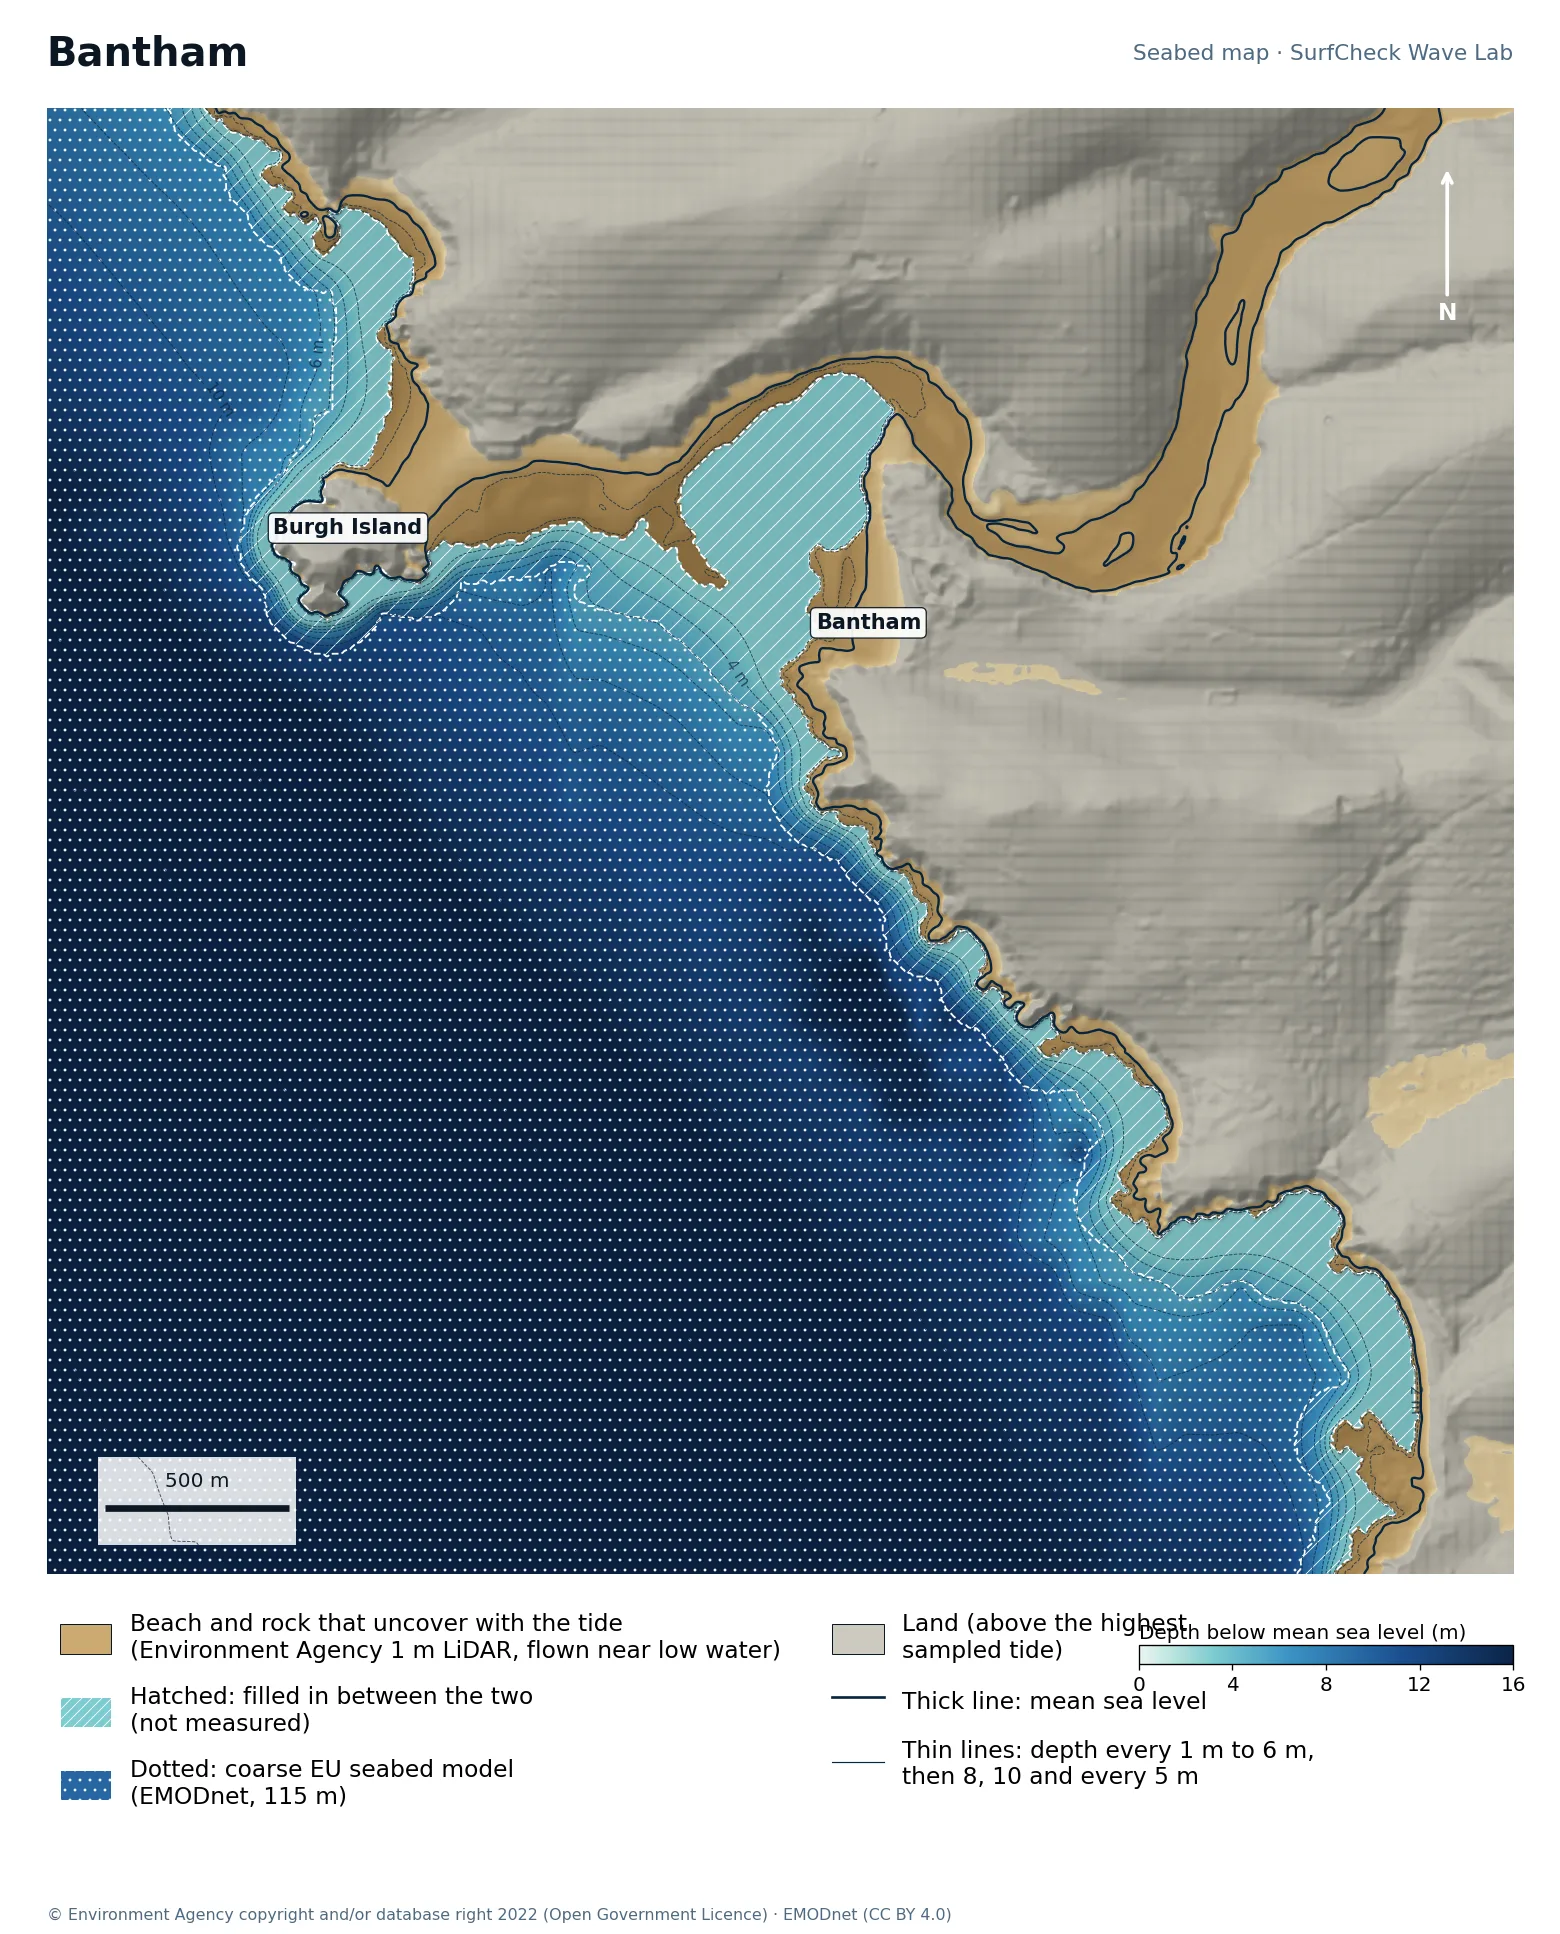
Seabed map of Bantham: depth contours, the reef or beach that uncovers with the tide, and which parts are measured
13%
of the sea here is measured
138 ha
uncovers with the tide
1 m
LiDAR on the beach
130 m
filled-in band, typical width

What the seabed shows

The River Avon meets the sea here, with Burgh Island and its tidal sandbar just to the west. The map shows the river channel winding inland; the bars at its mouth are what shape the wave.

How sure we are

The beach down to the water level on the day it was flown is Environment Agency 1 m airborne LiDAR. Below that a band about 130 m wide is filled in out to the coarse EU model. Sand at a river mouth moves constantly, and the model has no river current.

In the Wave Lab

Low confidence, because the seabed under the break is not measured. Swell direction is too close to call: the model cannot separate directions that differ by less than about 30% in breaker size. Breakers are about 8% bigger at high tide than at low.

Forecast and tides Run it in the Wave Lab

Cornwall · Reef beside a harbour

Porthleven

Shore only
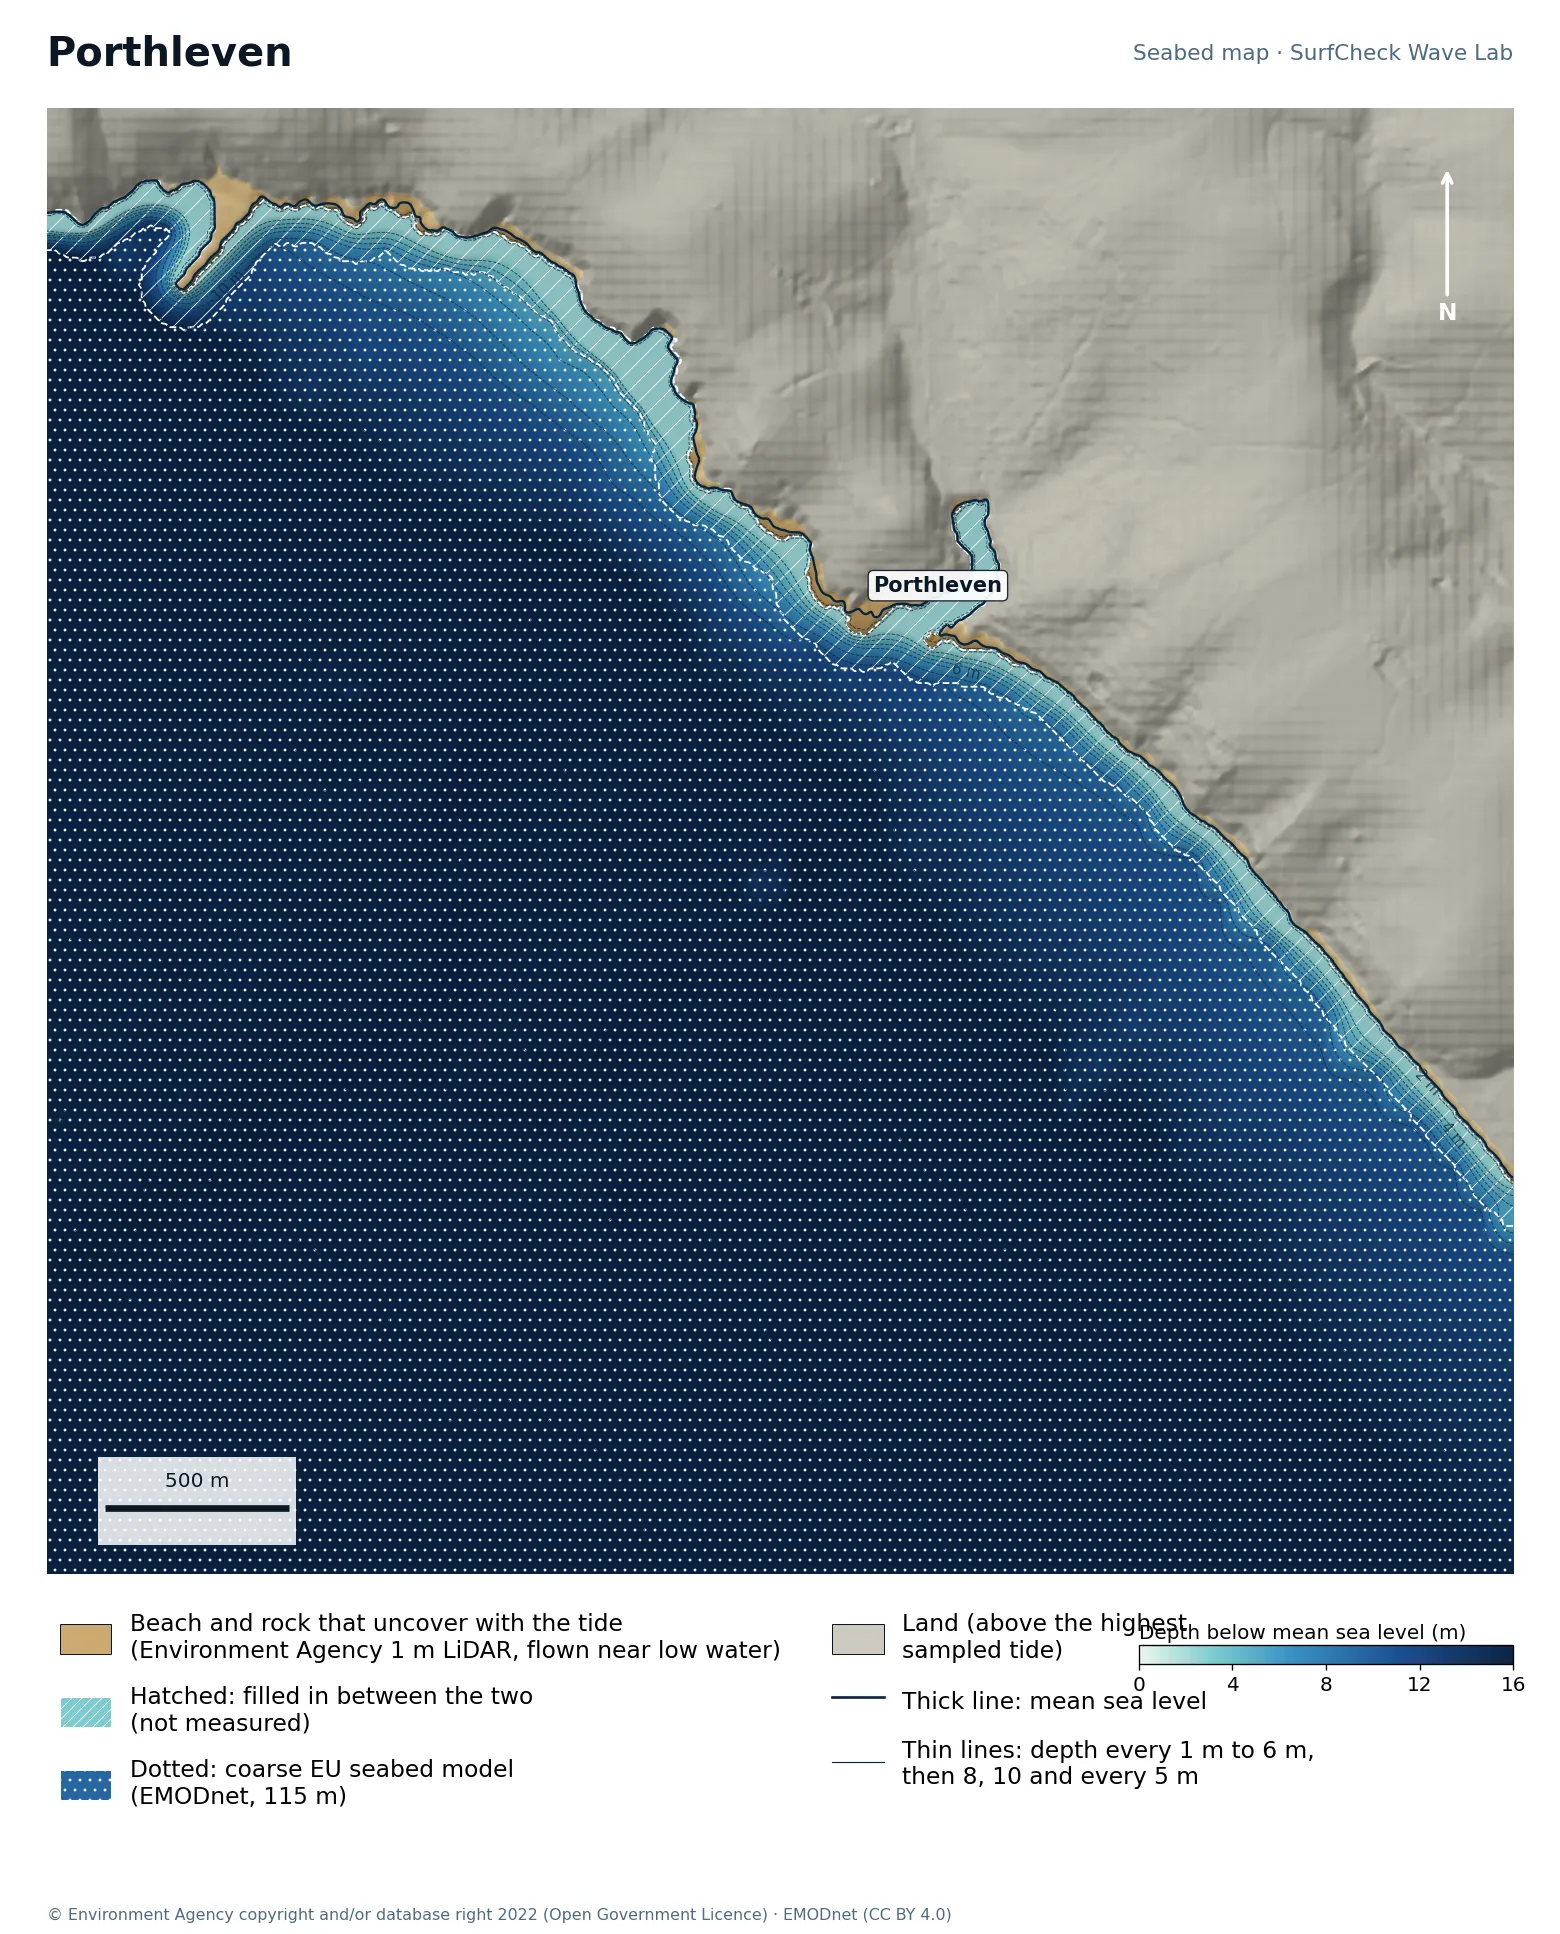
Seabed map of Porthleven: depth contours, the reef or beach that uncovers with the tide, and which parts are measured
1%
of the sea here is measured
14 ha
uncovers with the tide
1 m
LiDAR on the beach
130 m
filled-in band, typical width

What the seabed shows

A south-west-facing harbour with a rock shelf beside the entrance. Deep water lies close in, which is part of why the wave is powerful.

How sure we are

The beach down to the water level on the day it was flown is Environment Agency 1 m airborne LiDAR. Below that a band about 130 m wide is filled in out to the coarse EU model. The reef itself was under water when the coast was flown, so it is filled in, not measured.

In the Wave Lab

Low confidence, because the seabed under the break is not measured. Swell direction is too close to call: the model cannot separate directions that differ by less than about 30% in breaker size. Breakers are about 27% bigger at high tide than at low.
Forecast and tides Run it in the Wave Lab

Oʻahu, Hawaiʻi · Shallow reef close to shore

Pipeline

Compiled model
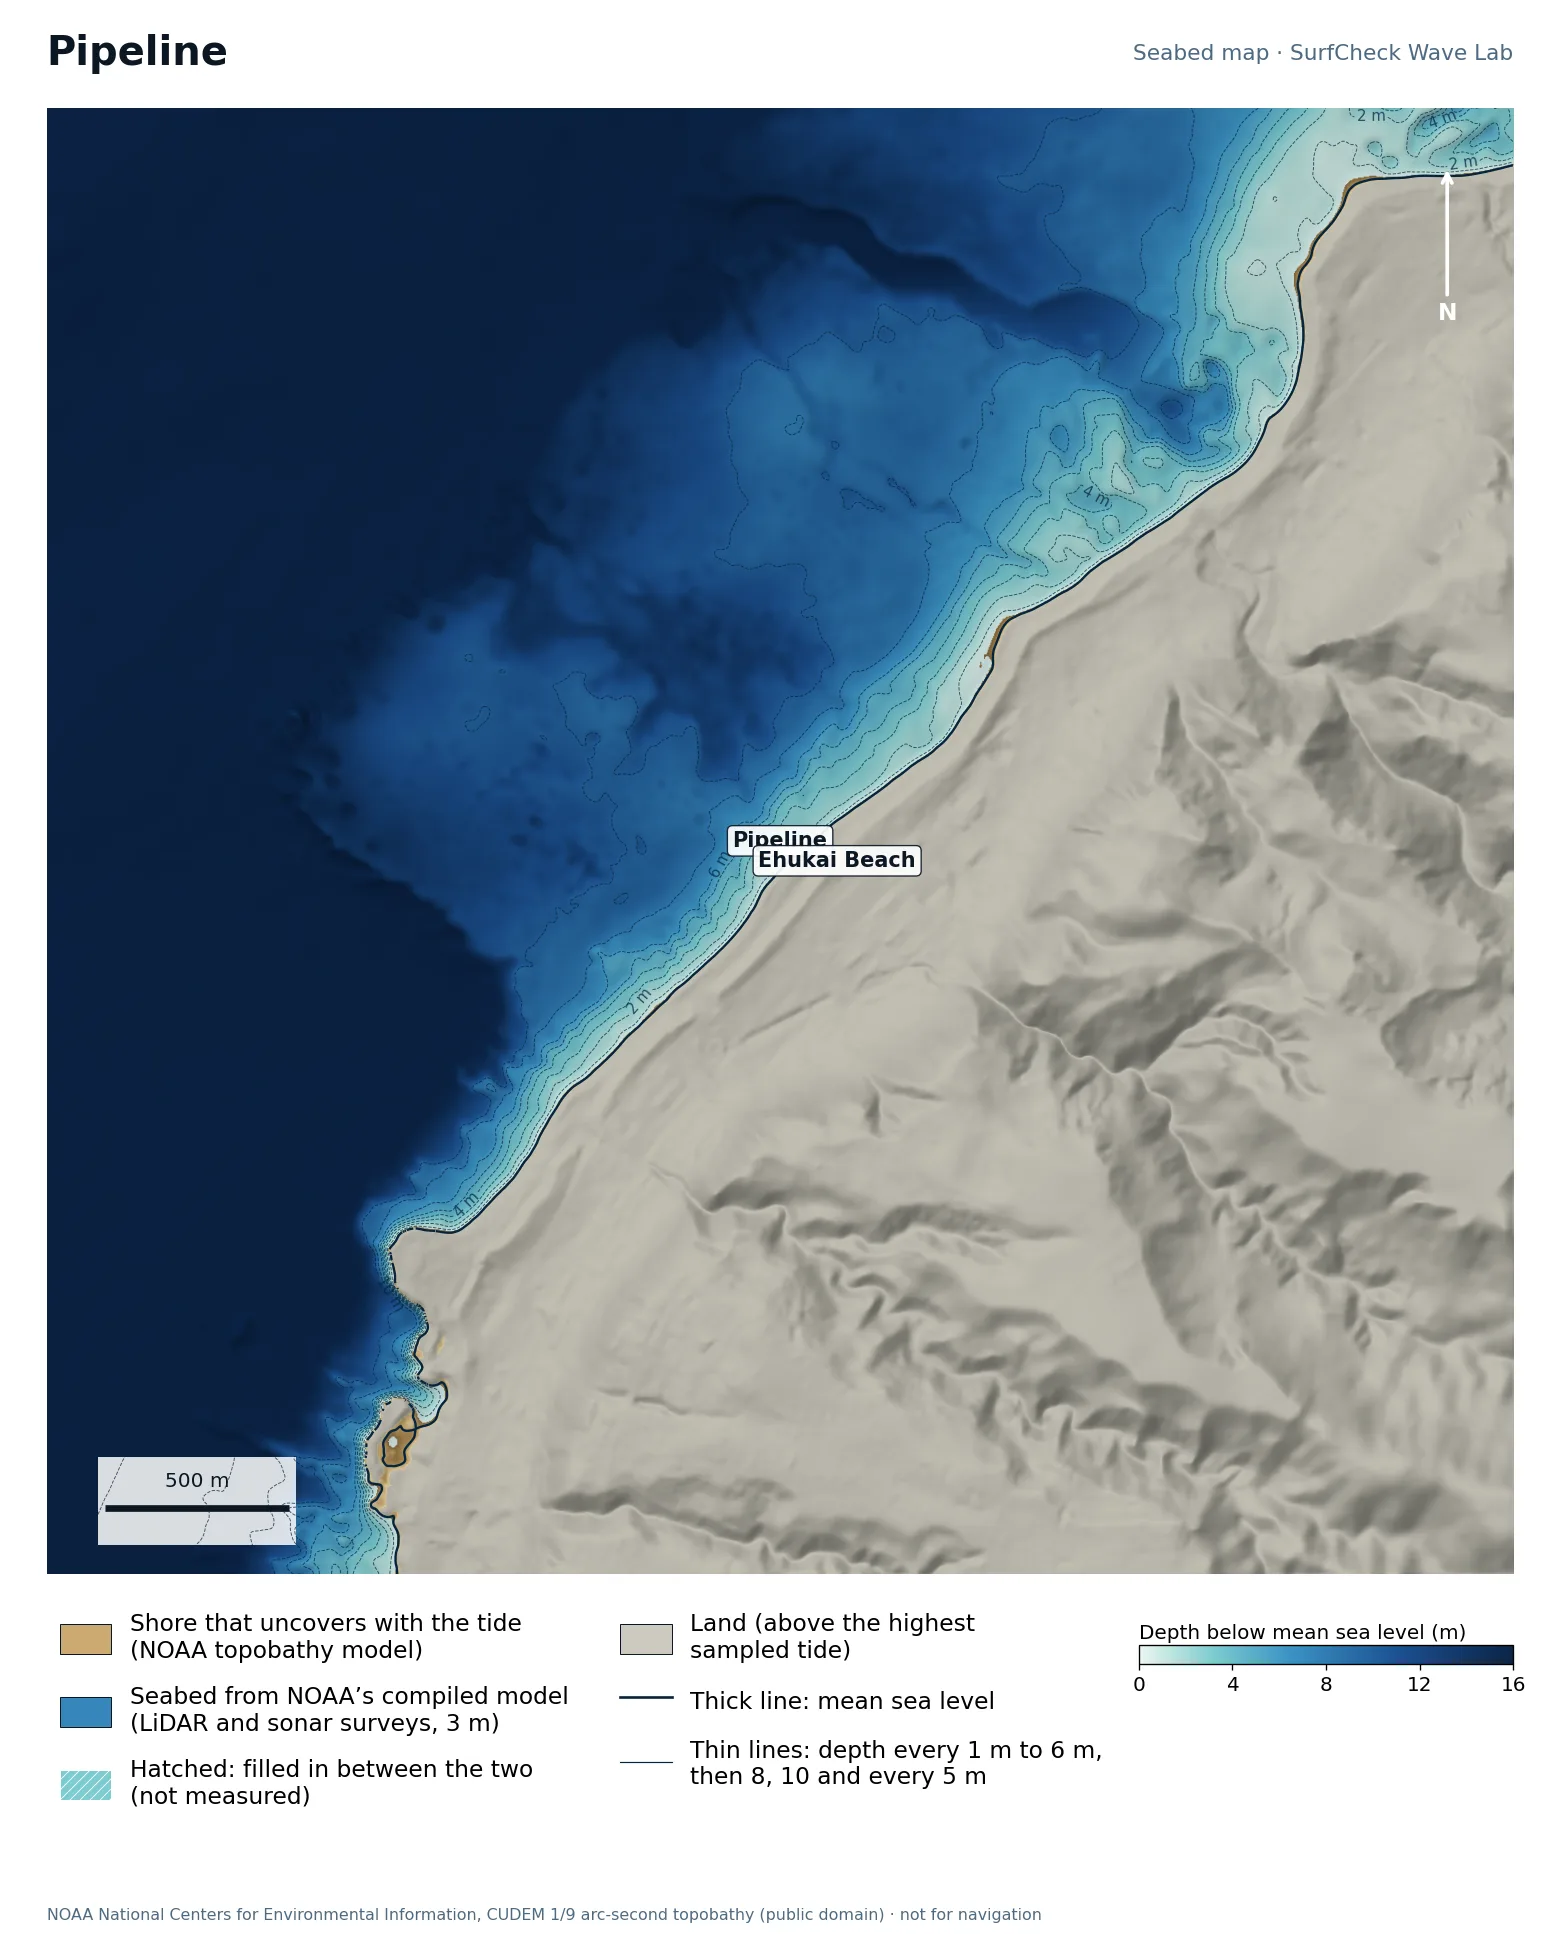
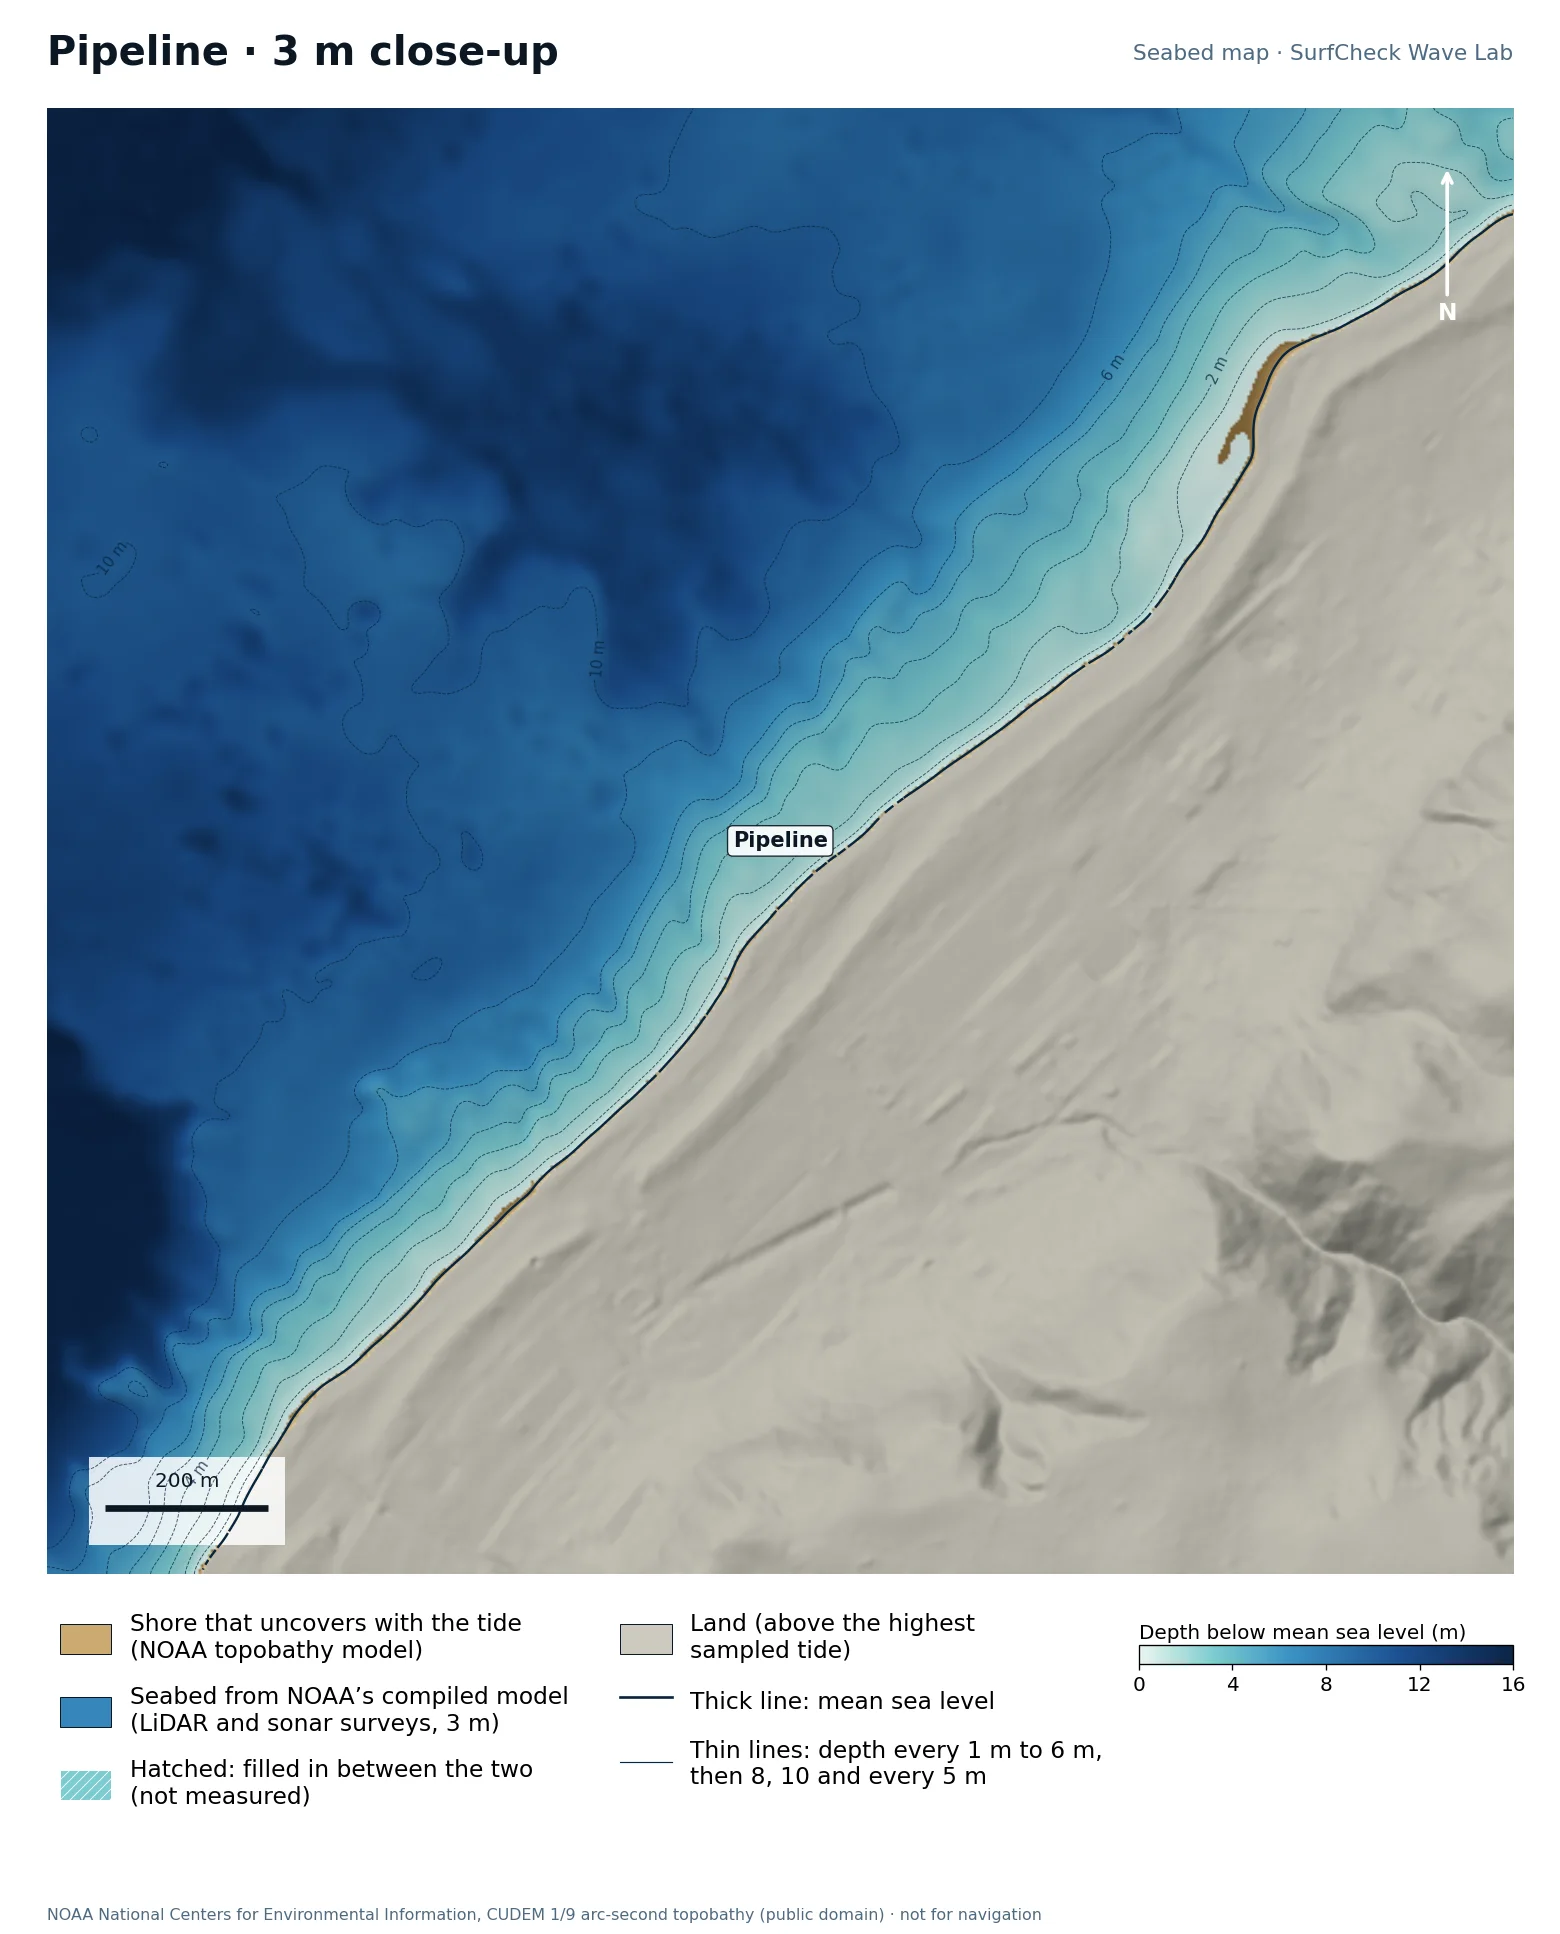
Seabed map of Pipeline: depth contours, the reef or beach that uncovers with the tide, and which parts are measuredClose-up of Pipeline in finer detail
100%
of the sea here is from NOAA’s compiled model
6 ha
uncovers with the tide
3 m
model grid
None
filled-in band, typical width

What the seabed shows

A flat lava reef shelf sits only a short distance off Ehukai Beach, with deeper water outside it. The close-up shows how quickly the seabed rises to the reef, which is what makes the wave so hollow.

How sure we are

The whole map is NOAA’s CUDEM topobathy model at about 3 m, compiled from airborne LiDAR and sonar surveys. It is a finished model: NOAA fills gaps itself and does not mark where, so nothing is hatched here even though some of it will be interpolated.

In the Wave Lab

Not ranked. The seabed here is a compiled model that does not say which depths were measured, so we do not publish a swell ranking from it.

Run it in the Wave Lab

Oʻahu, Hawaiʻi · Wide reef with deep channels

Sunset Beach

Compiled model
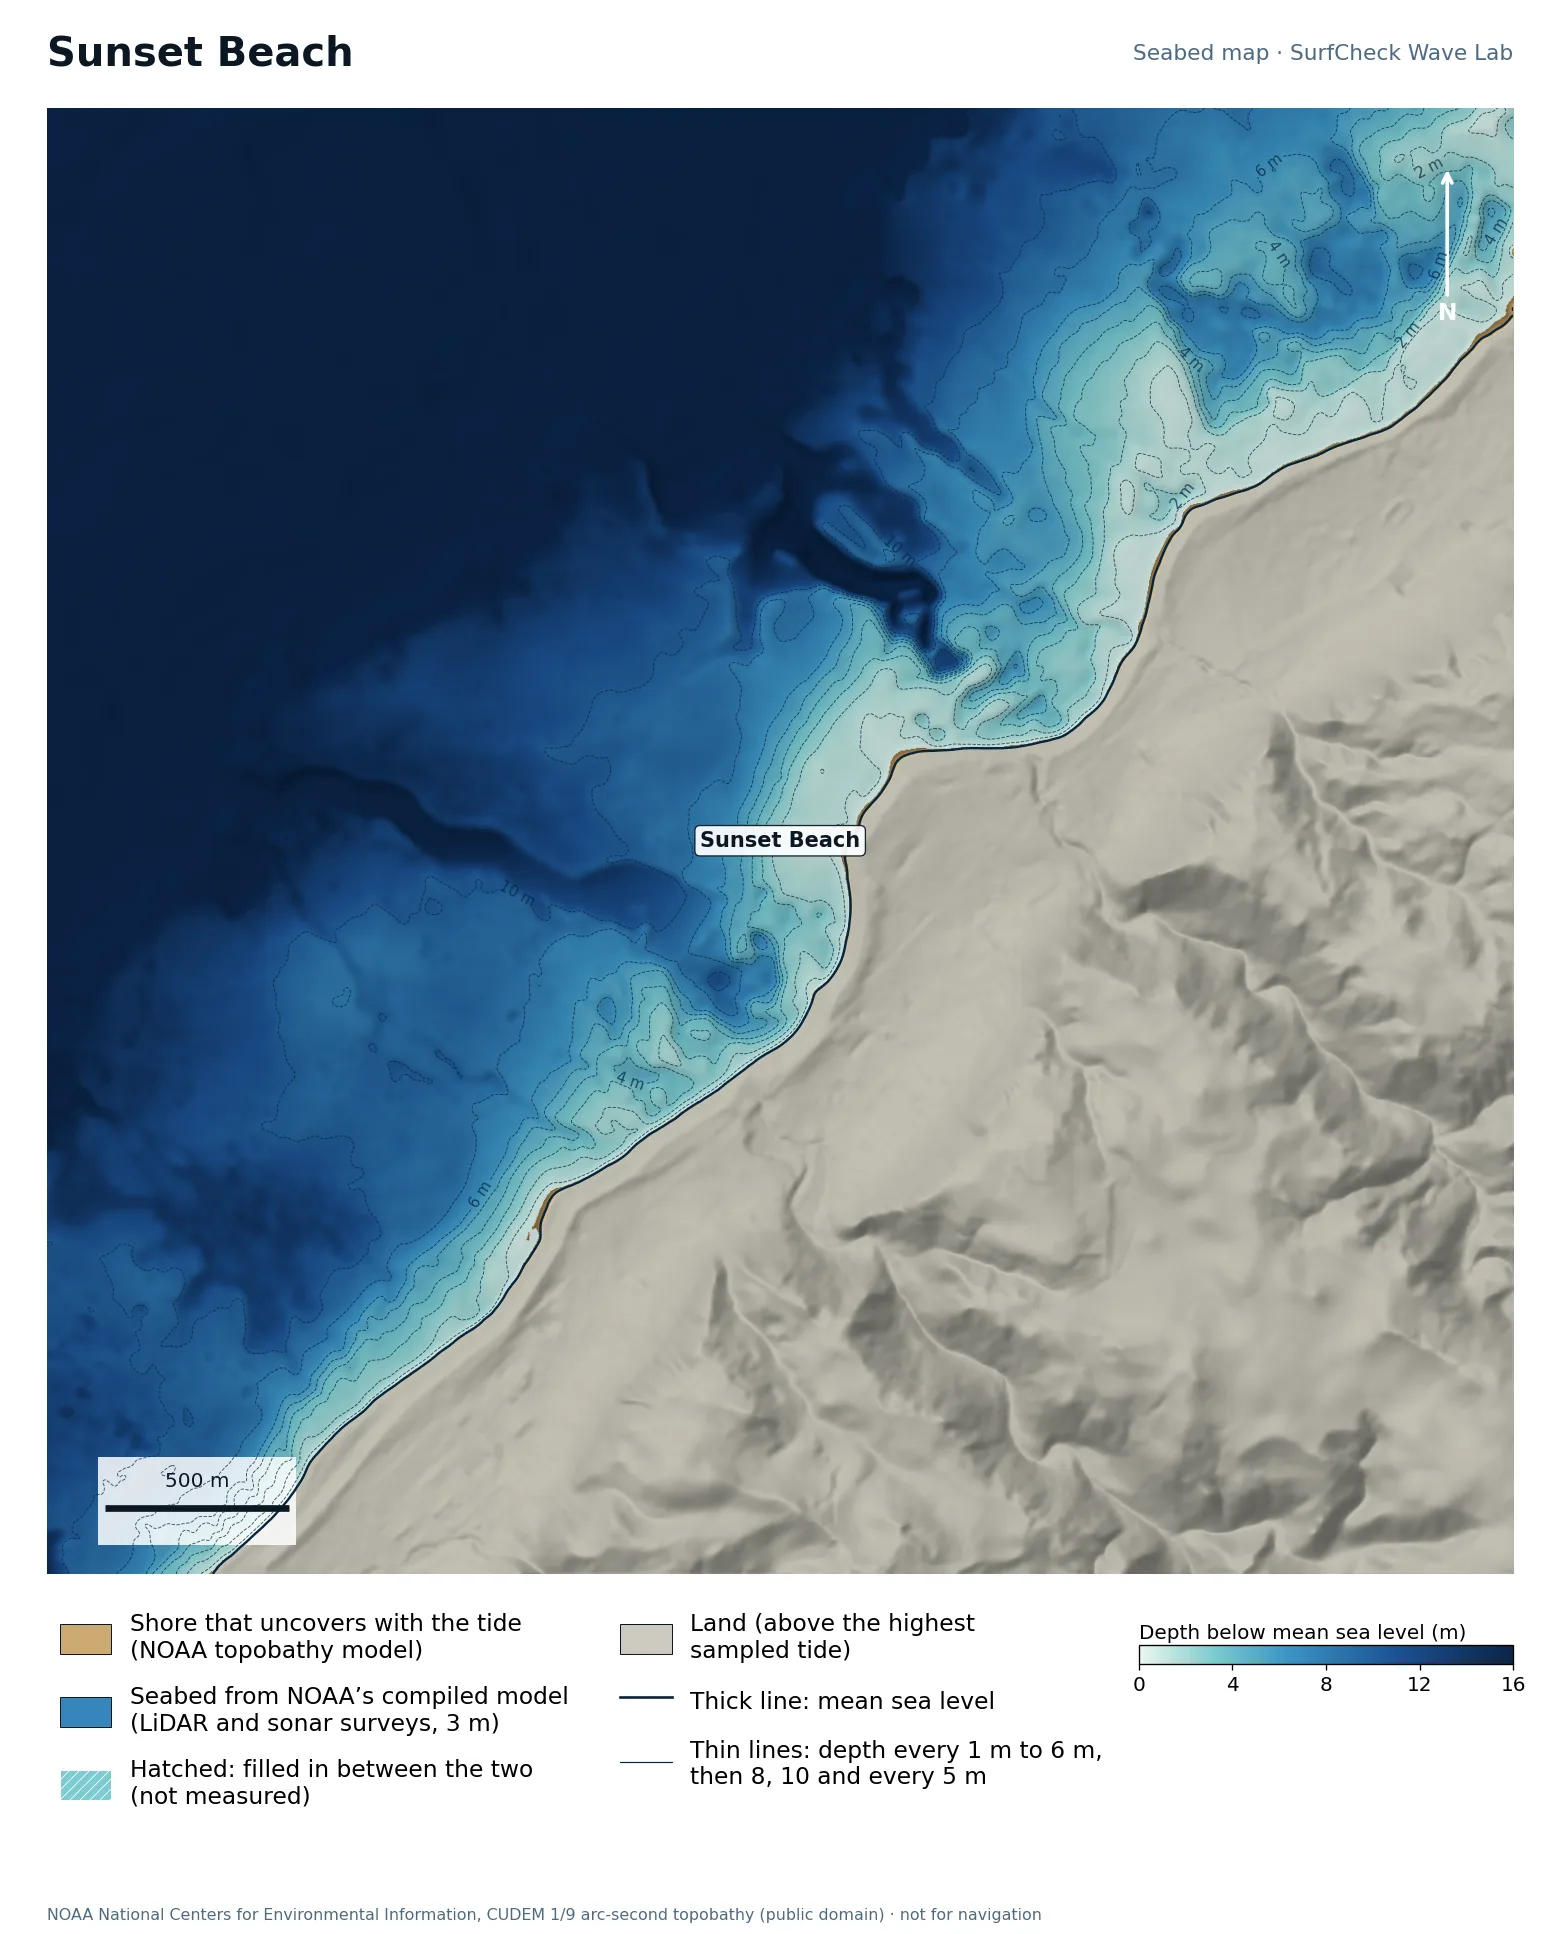
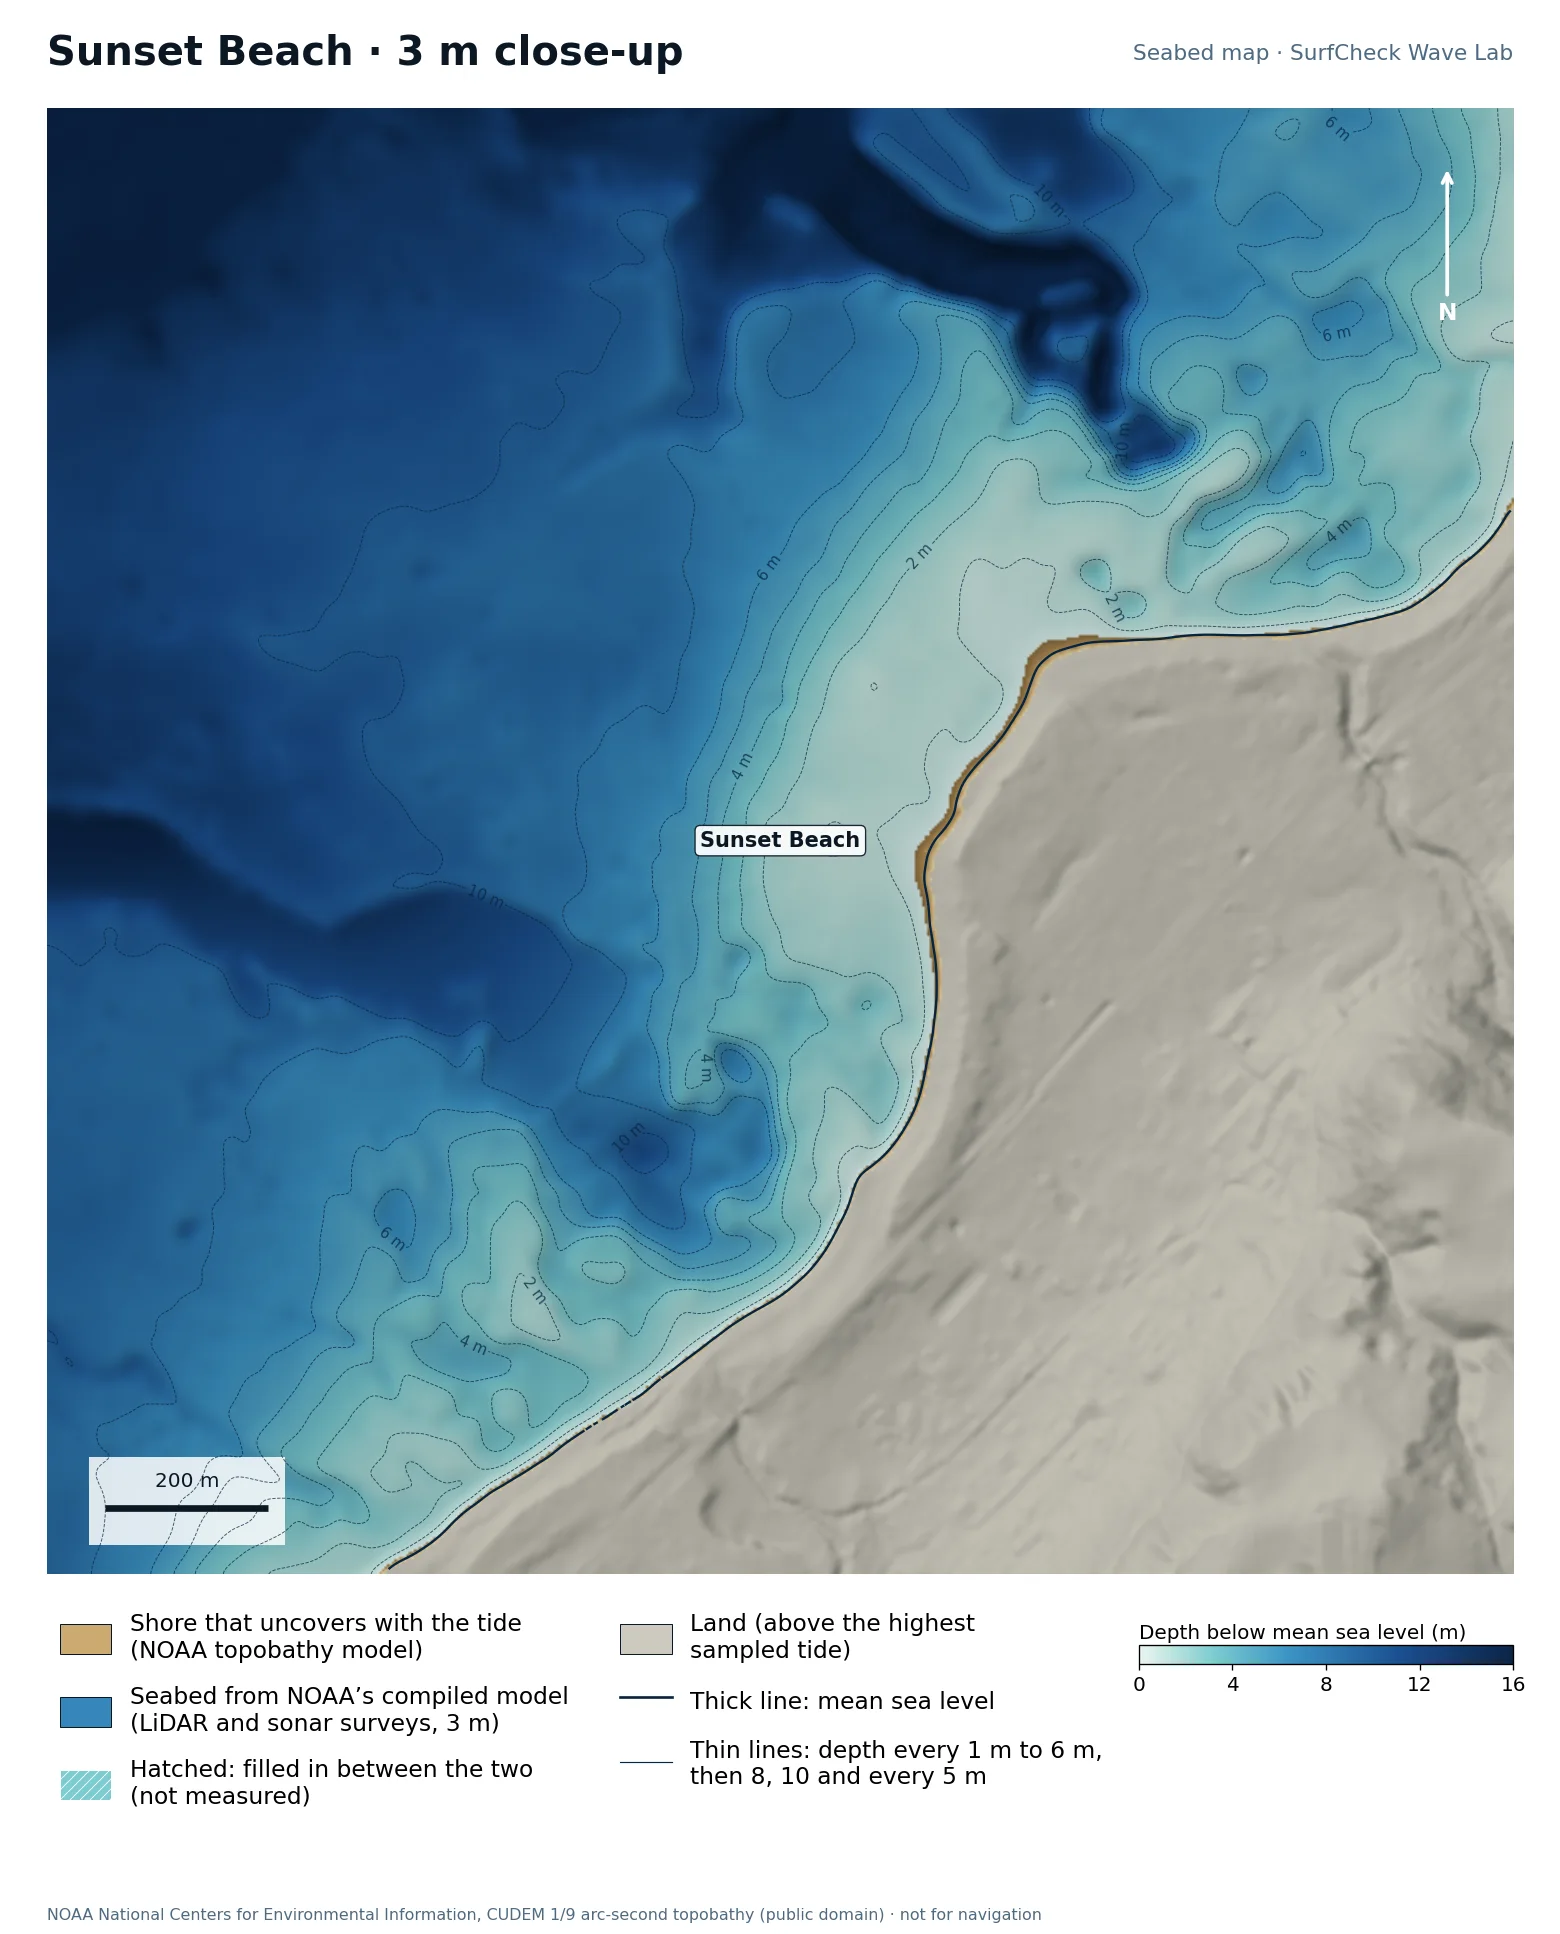
Seabed map of Sunset Beach: depth contours, the reef or beach that uncovers with the tide, and which parts are measuredClose-up of Sunset Beach in finer detail
100%
of the sea here is from NOAA’s compiled model
5 ha
uncovers with the tide
3 m
model grid
None
filled-in band, typical width

What the seabed shows

A broad reef platform reaching well out from the beach, cut by deeper channels. Swell from different directions meets different parts of it, which is why the peak moves around so much.

How sure we are

The whole map is NOAA’s CUDEM topobathy model at about 3 m, compiled from airborne LiDAR and sonar surveys. It is a finished model: NOAA fills gaps itself and does not mark where, so nothing is hatched here even though some of it will be interpolated.

In the Wave Lab

Not ranked. The seabed here is a compiled model that does not say which depths were measured, so we do not publish a swell ranking from it.

Run it in the Wave Lab

Oʻahu, Hawaiʻi · Big-wave bay

Waimea Bay

Compiled model
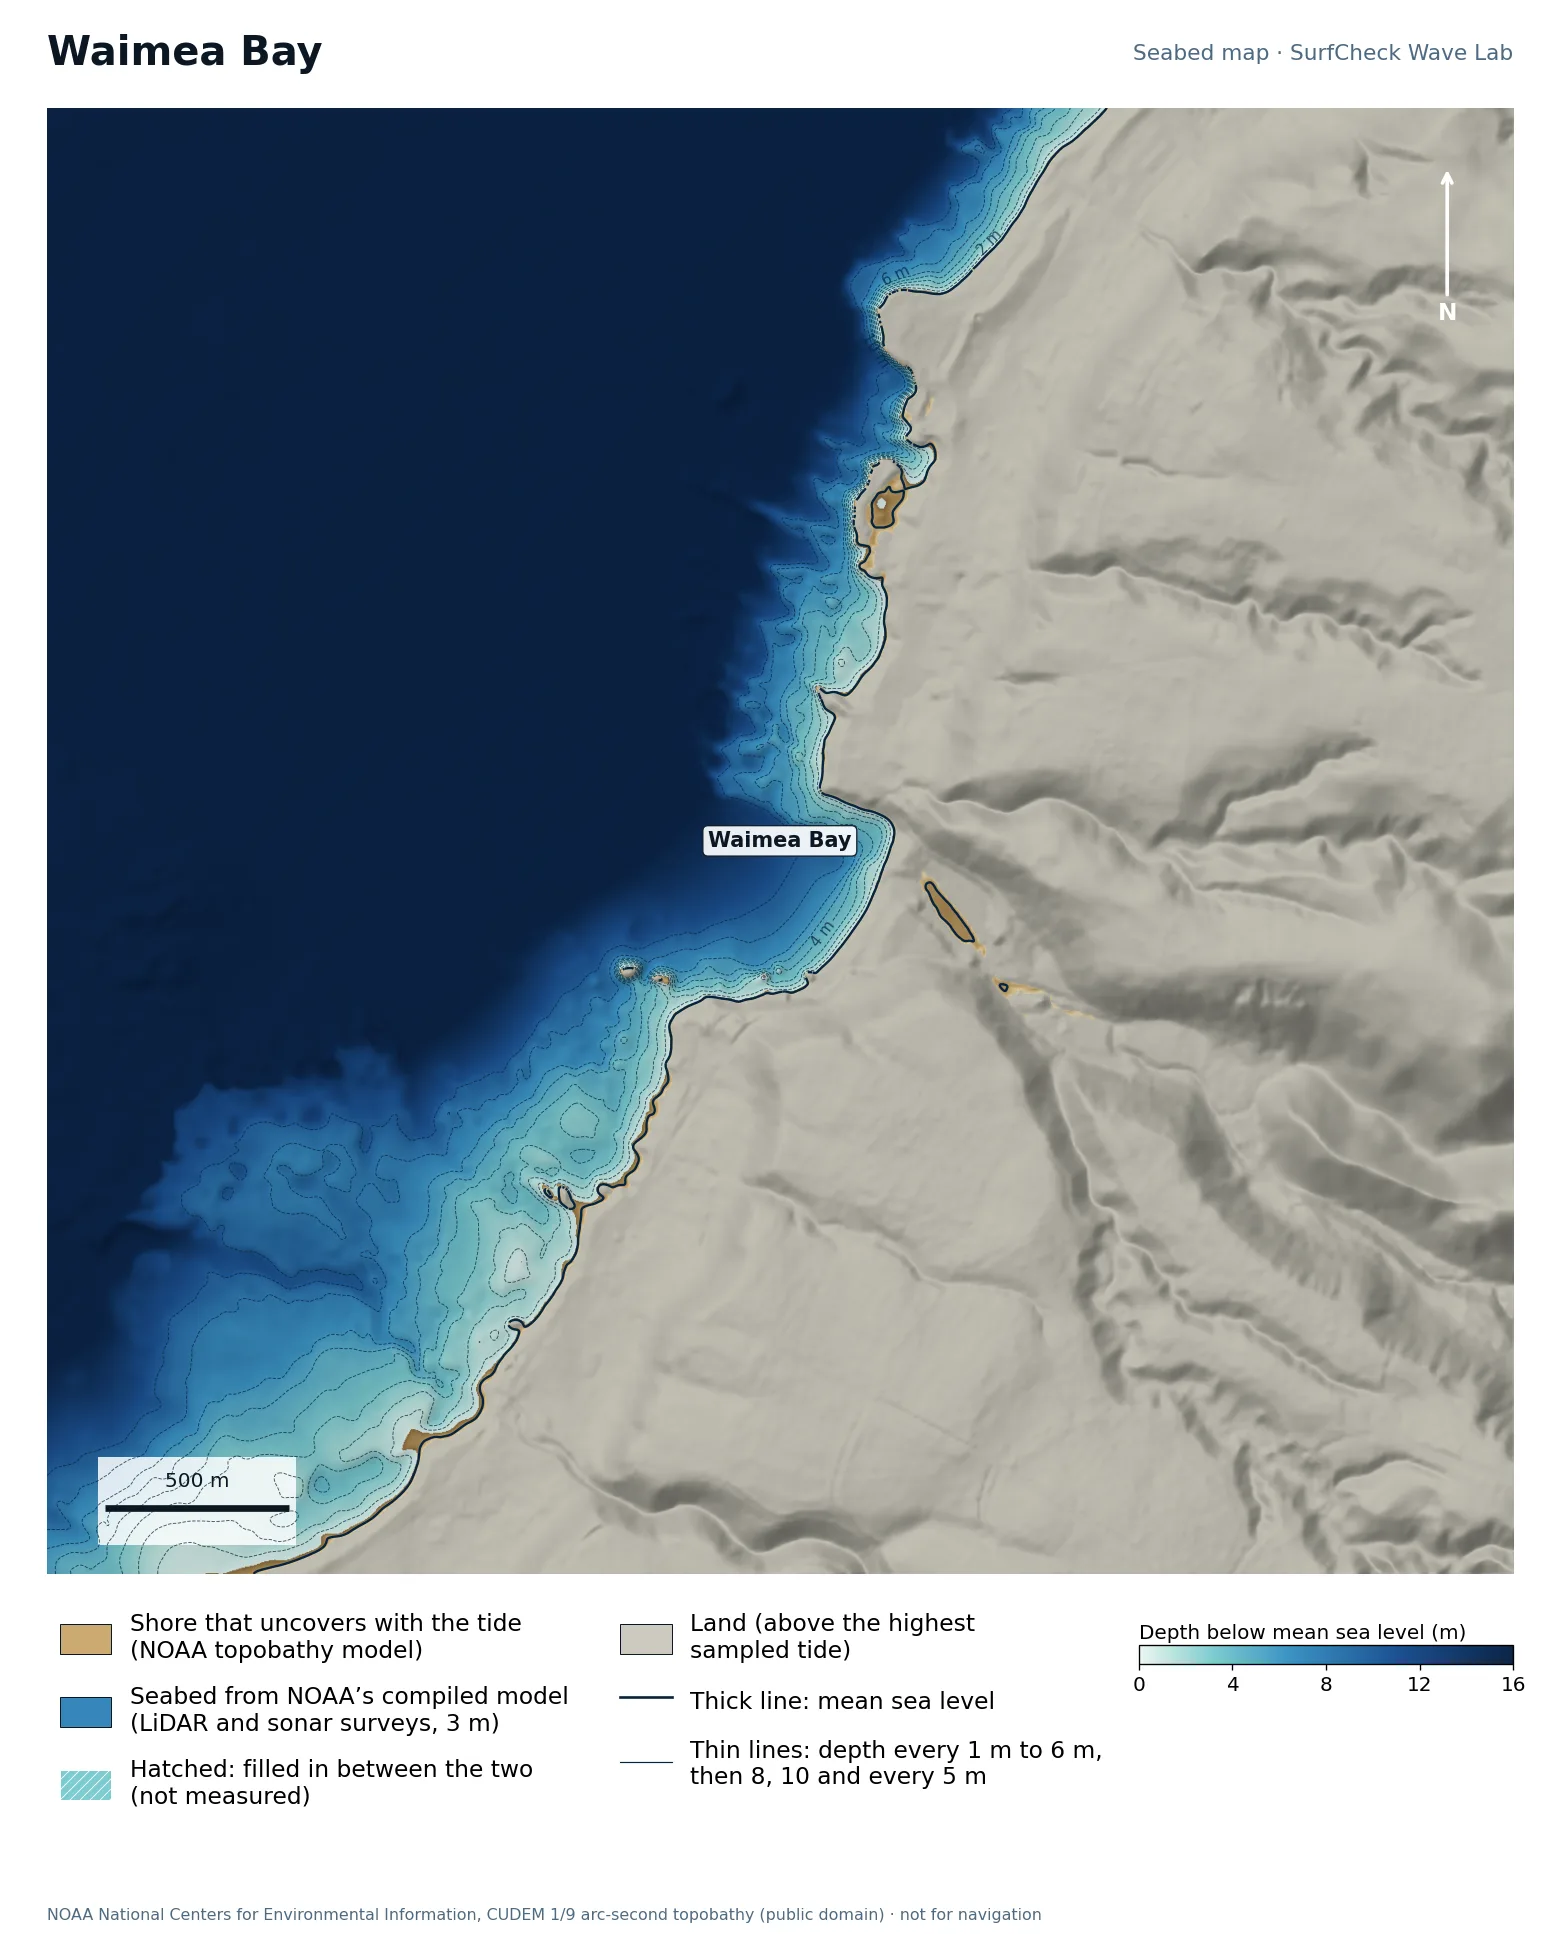
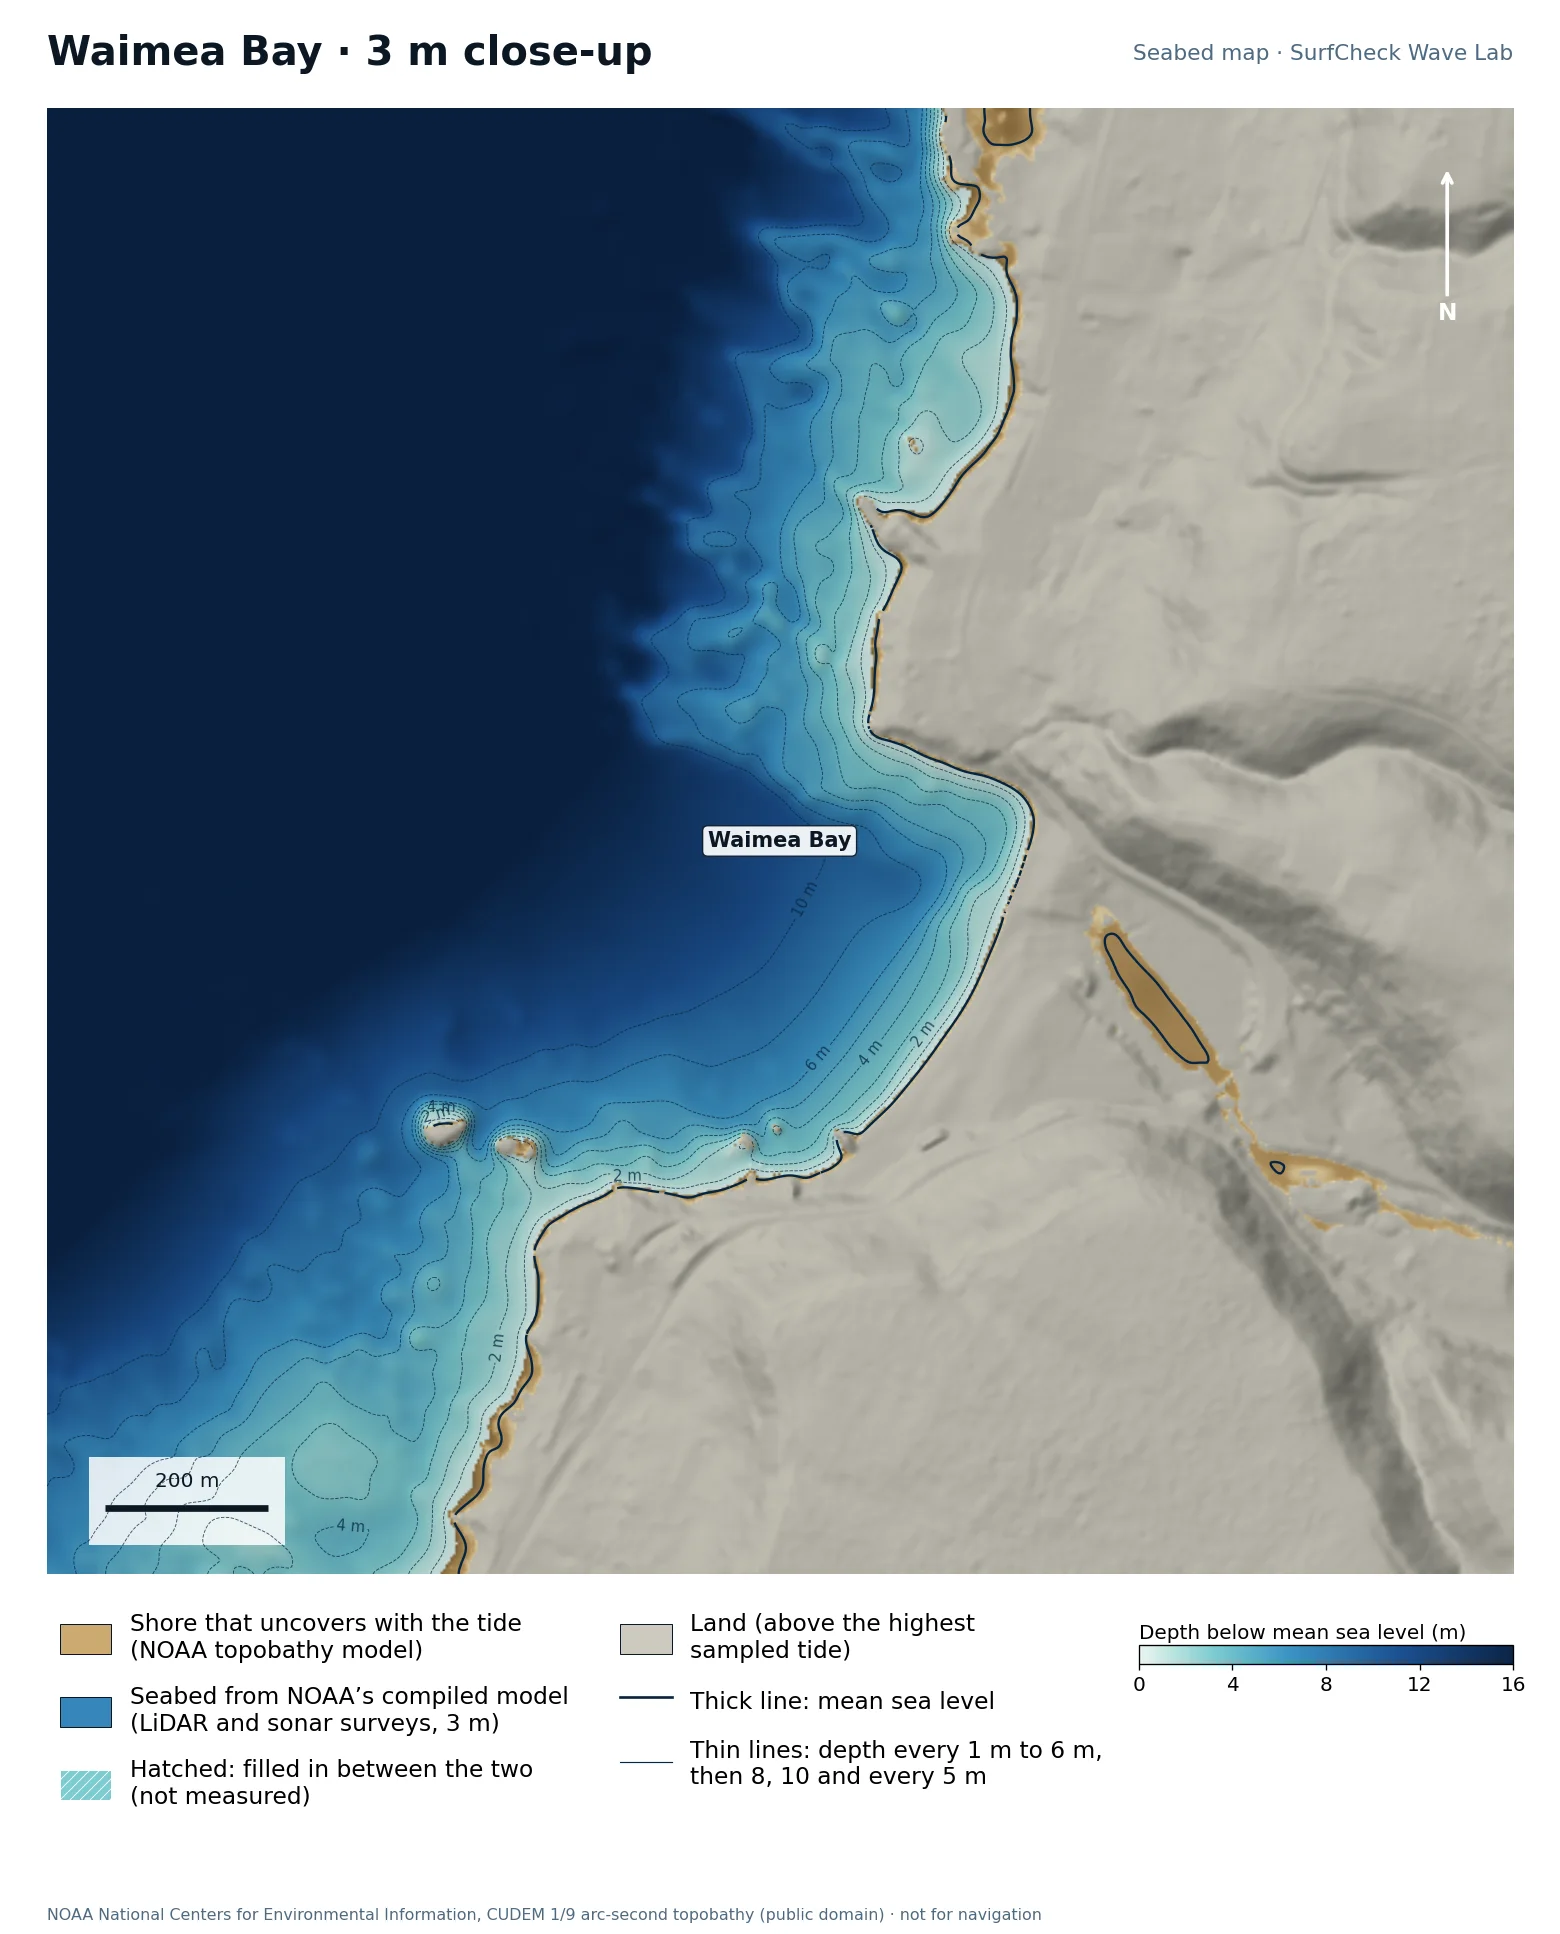
Seabed map of Waimea Bay: depth contours, the reef or beach that uncovers with the tide, and which parts are measuredClose-up of Waimea Bay in finer detail
100%
of the sea here is from NOAA’s compiled model
11 ha
uncovers with the tide
3 m
model grid
None
filled-in band, typical width

What the seabed shows

A deep, steep-sided bay with a rocky point on its north side. Deep water runs close in beside the point.

How sure we are

The whole map is NOAA’s CUDEM topobathy model at about 3 m, compiled from airborne LiDAR and sonar surveys. It is a finished model: NOAA fills gaps itself and does not mark where, so nothing is hatched here even though some of it will be interpolated.

In the Wave Lab

Not ranked. The seabed here is a compiled model that does not say which depths were measured, so we do not publish a swell ranking from it.

Run it in the Wave Lab

Half Moon Bay, California · Big-wave reef off a headland

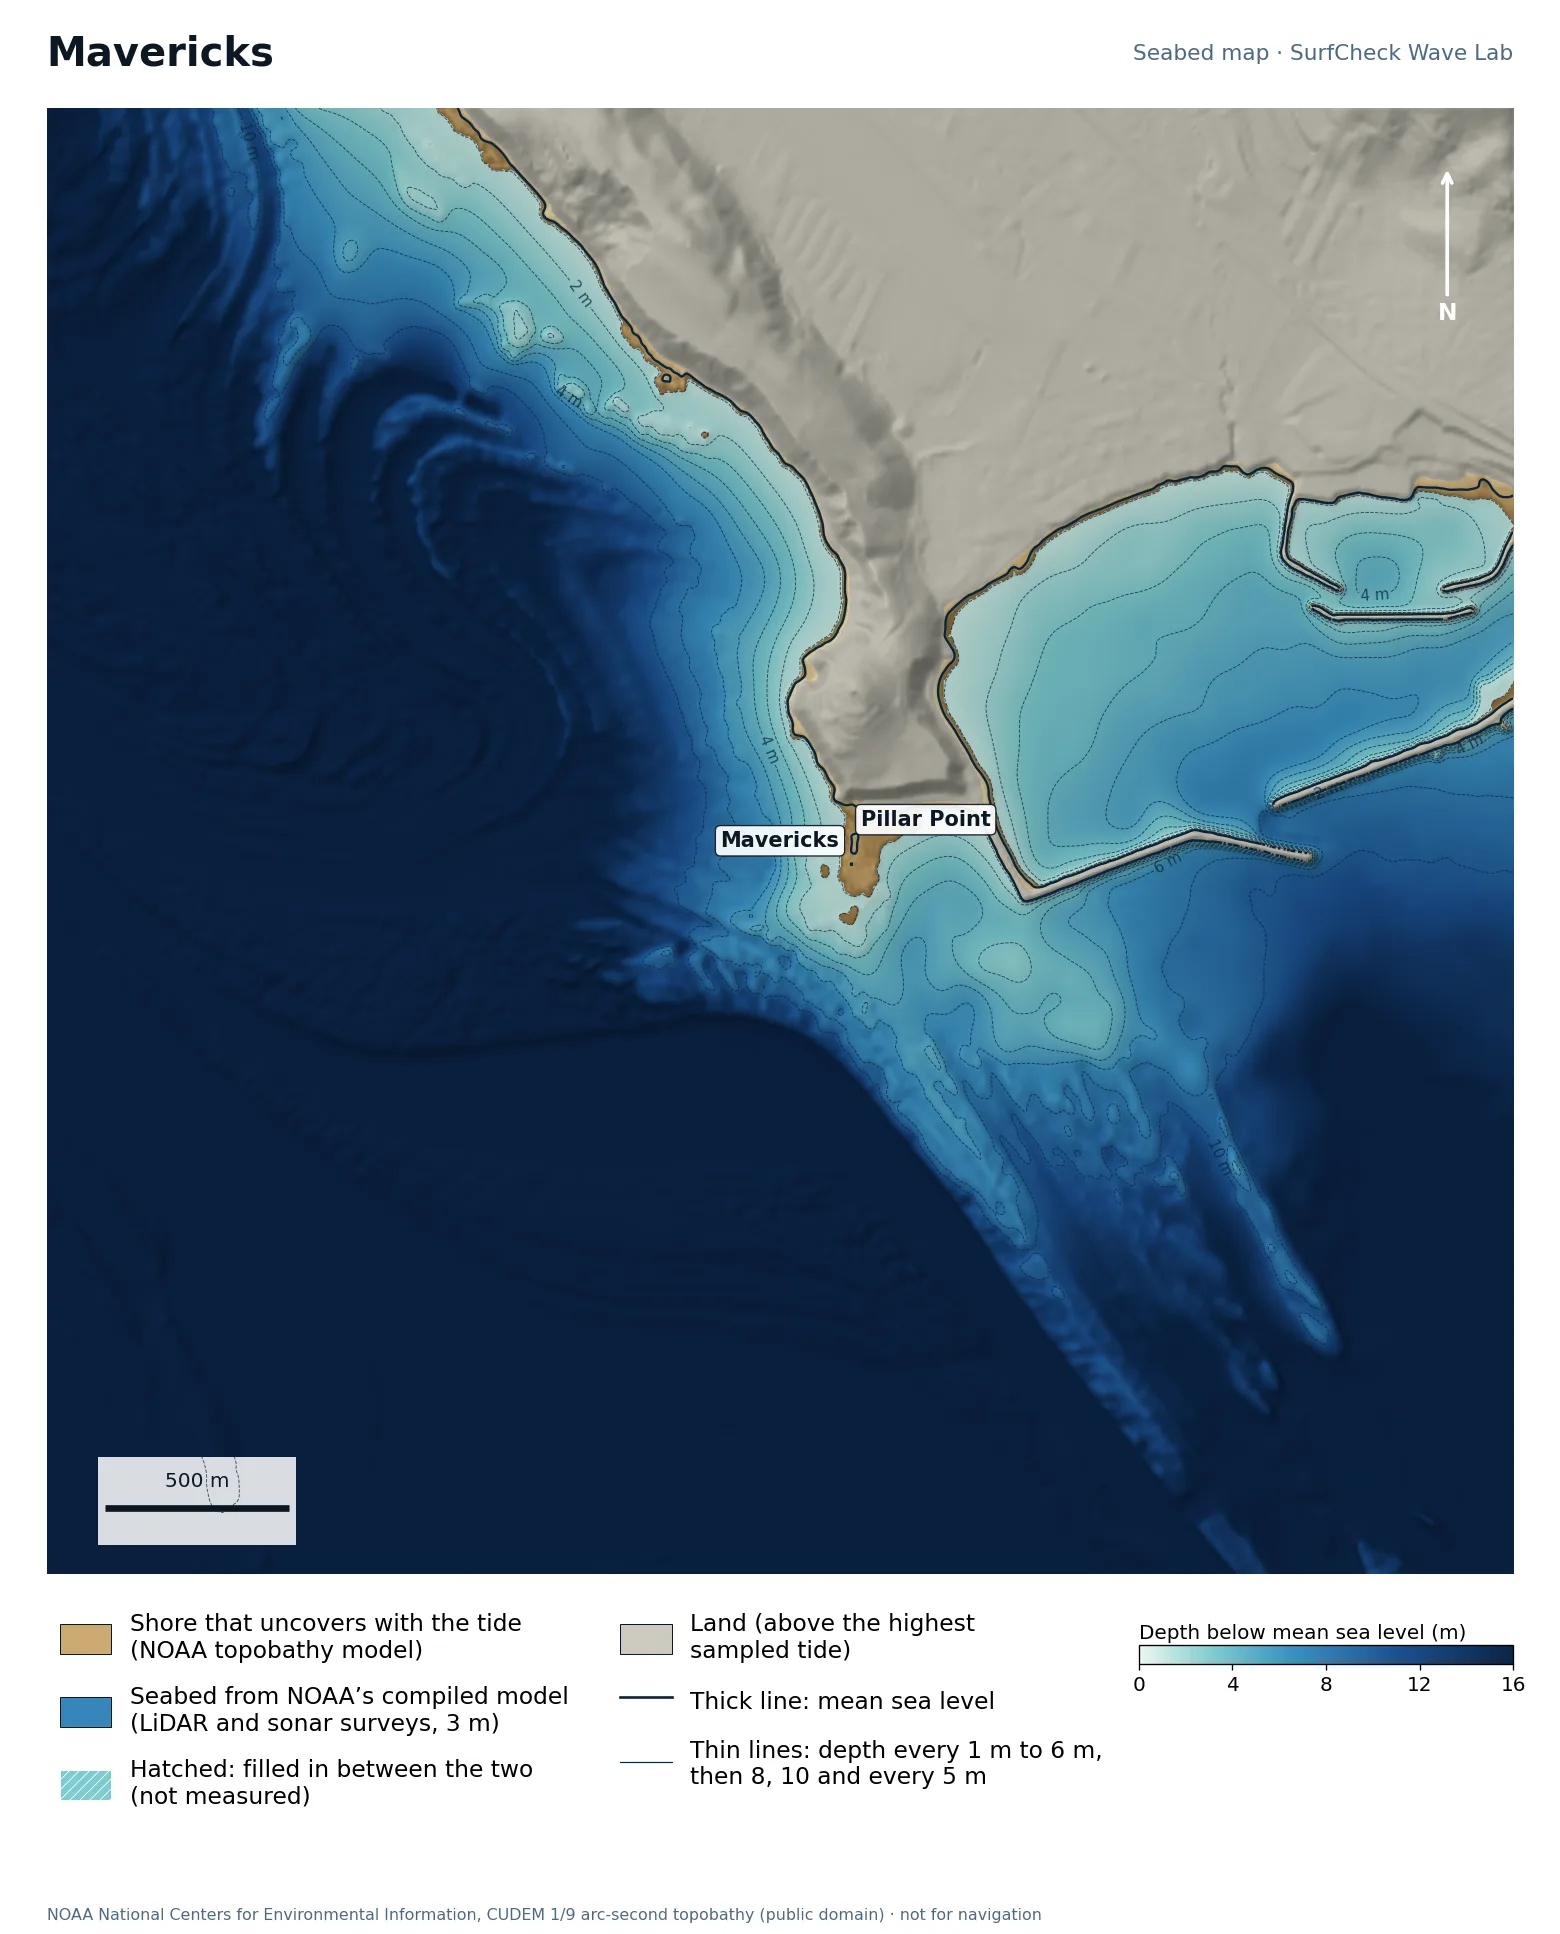
Mavericks

Compiled model
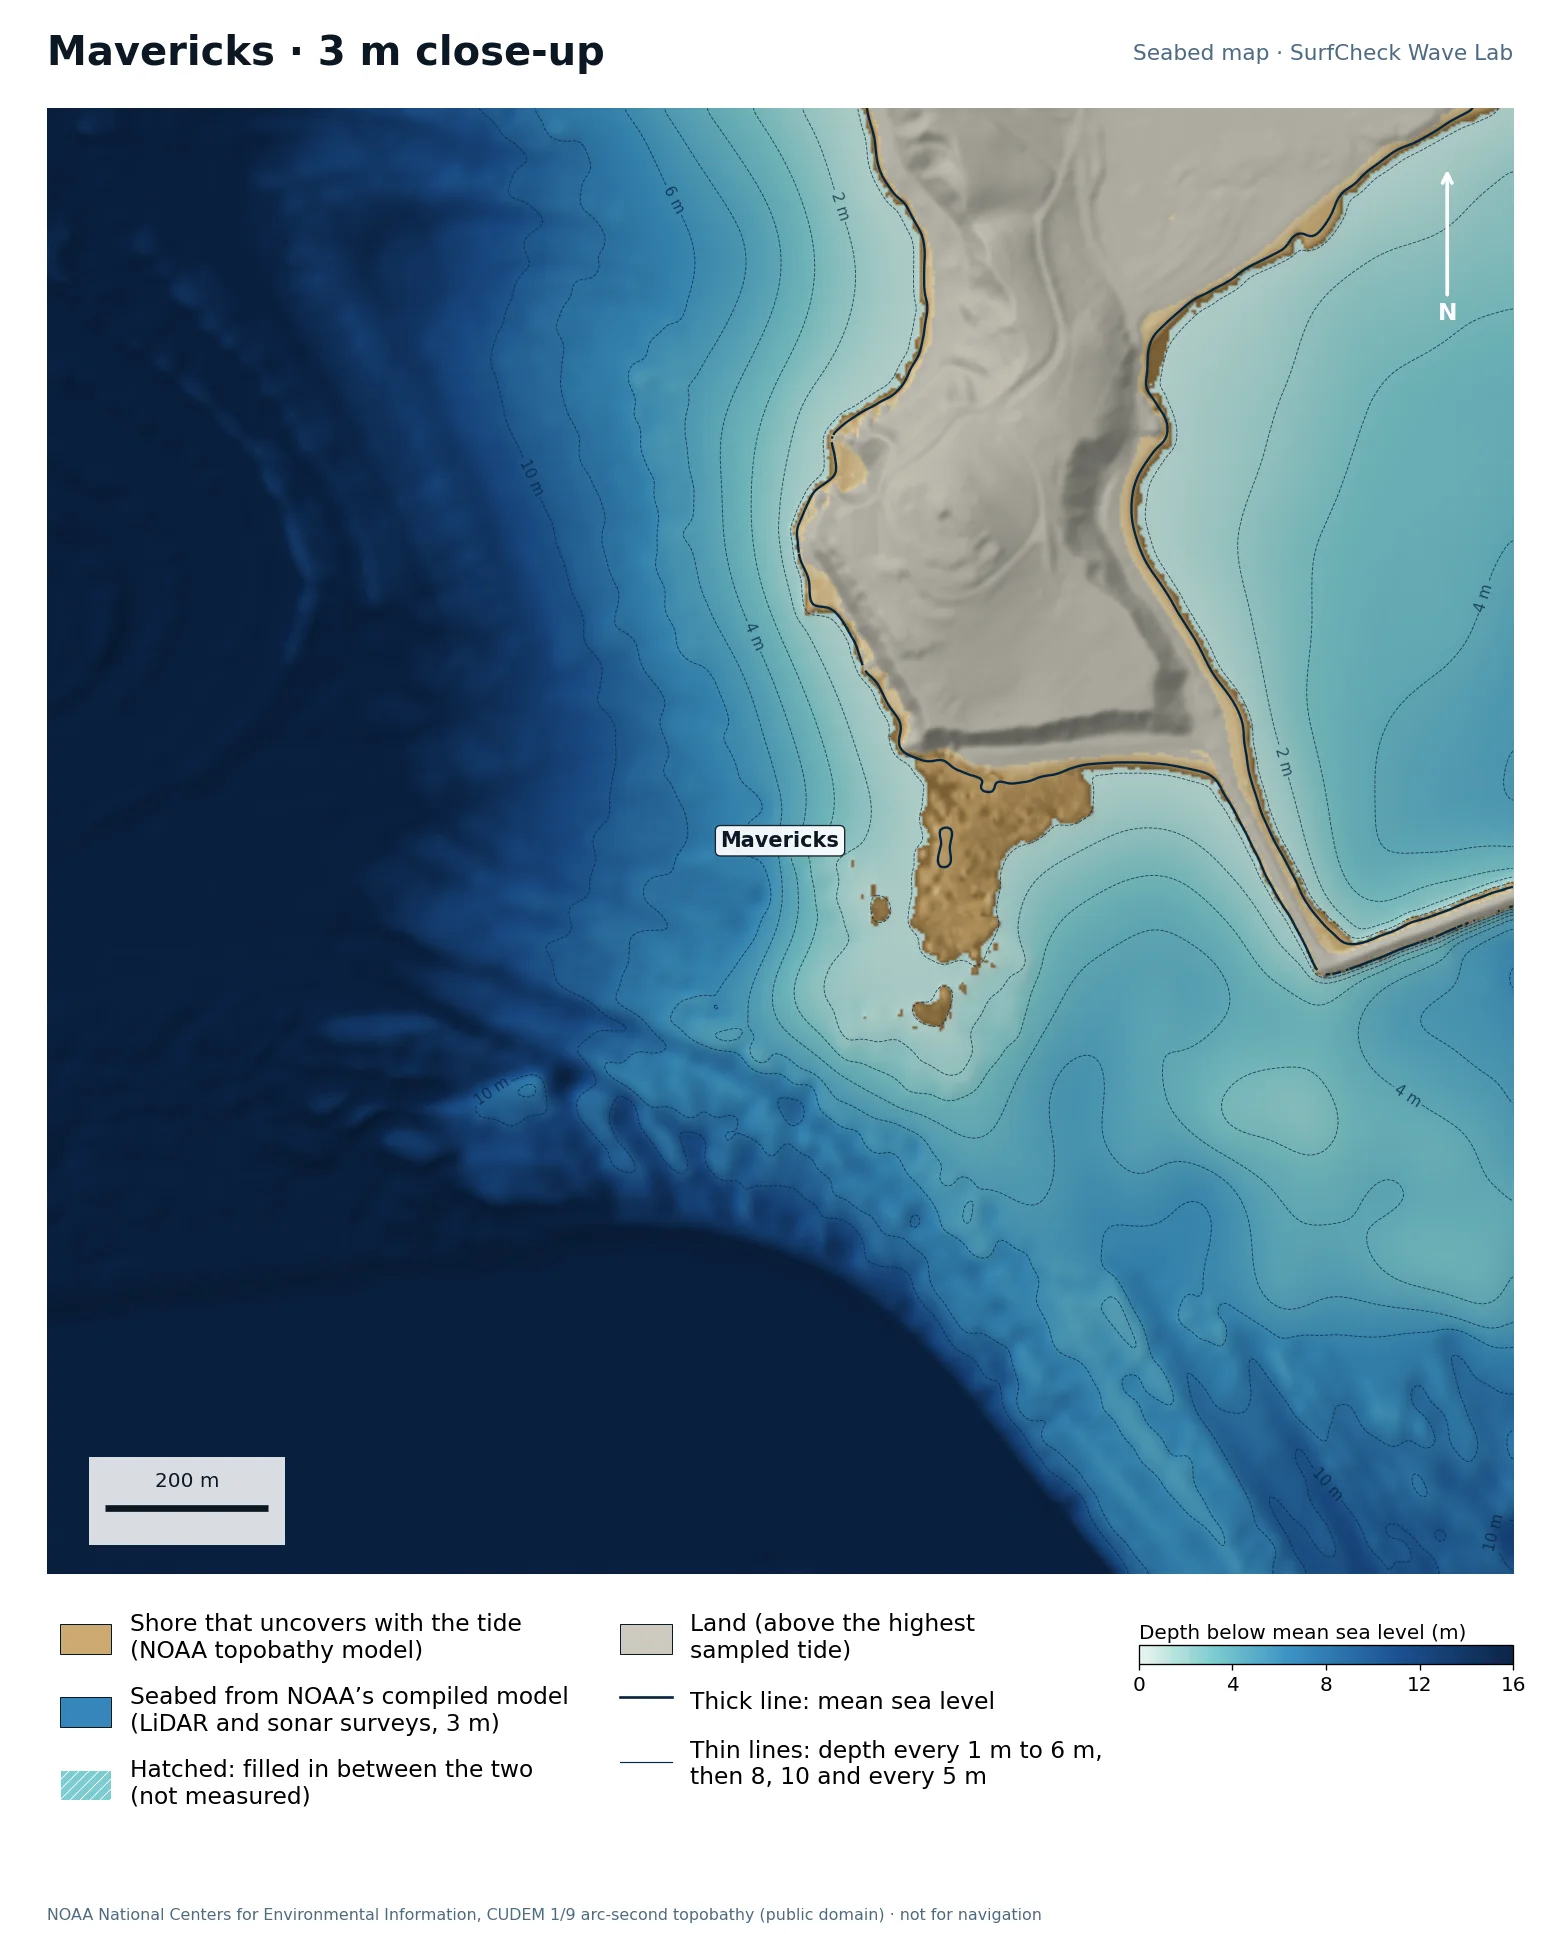
Seabed map of Mavericks: depth contours, the reef or beach that uncovers with the tide, and which parts are measuredClose-up of Mavericks in finer detail
100%
of the sea here is from NOAA’s compiled model
19 ha
uncovers with the tide
3 m
model grid
None
filled-in band, typical width

What the seabed shows

A tongue of rock runs seaward from Pillar Point, with deeper water on either side and a long ridge trailing south-east. The harbour breakwaters are visible to the east. The ramp shape of the reef is plain on the map.

How sure we are

The whole map is NOAA’s CUDEM topobathy model at about 3 m, compiled from airborne LiDAR and sonar surveys. It is a finished model: NOAA fills gaps itself and does not mark where, so nothing is hatched here even though some of it will be interpolated.

In the Wave Lab

Not ranked. The seabed here is a compiled model that does not say which depths were measured, so we do not publish a swell ranking from it.

Run it in the Wave Lab

Santa Cruz, California · Point break under a cliff

Steamer Lane

Compiled model
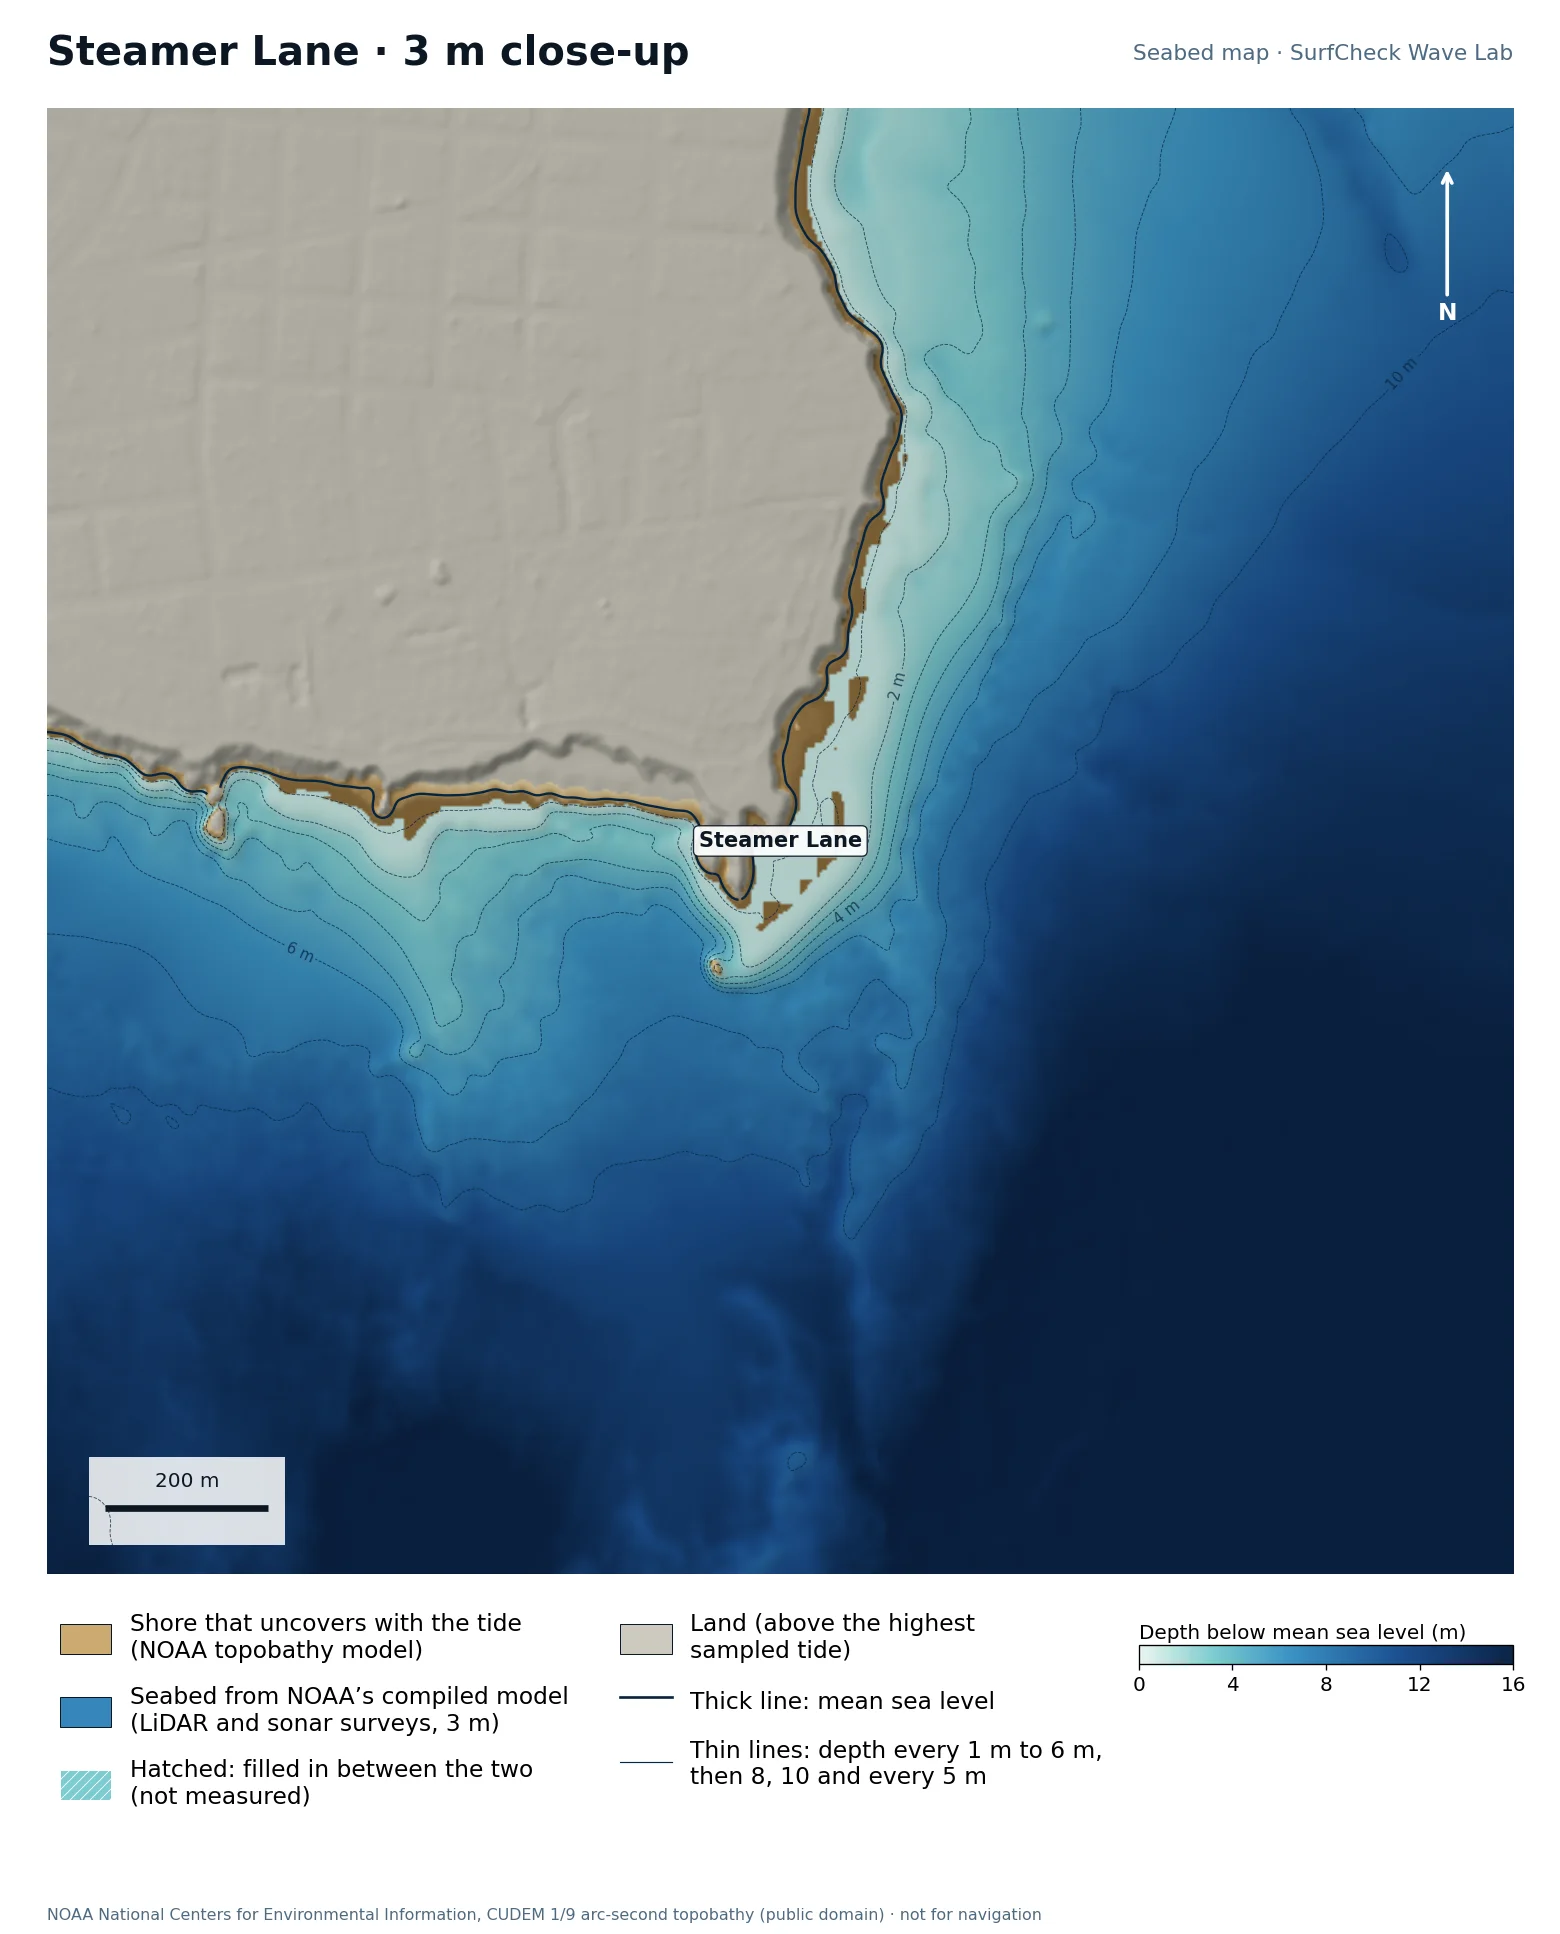
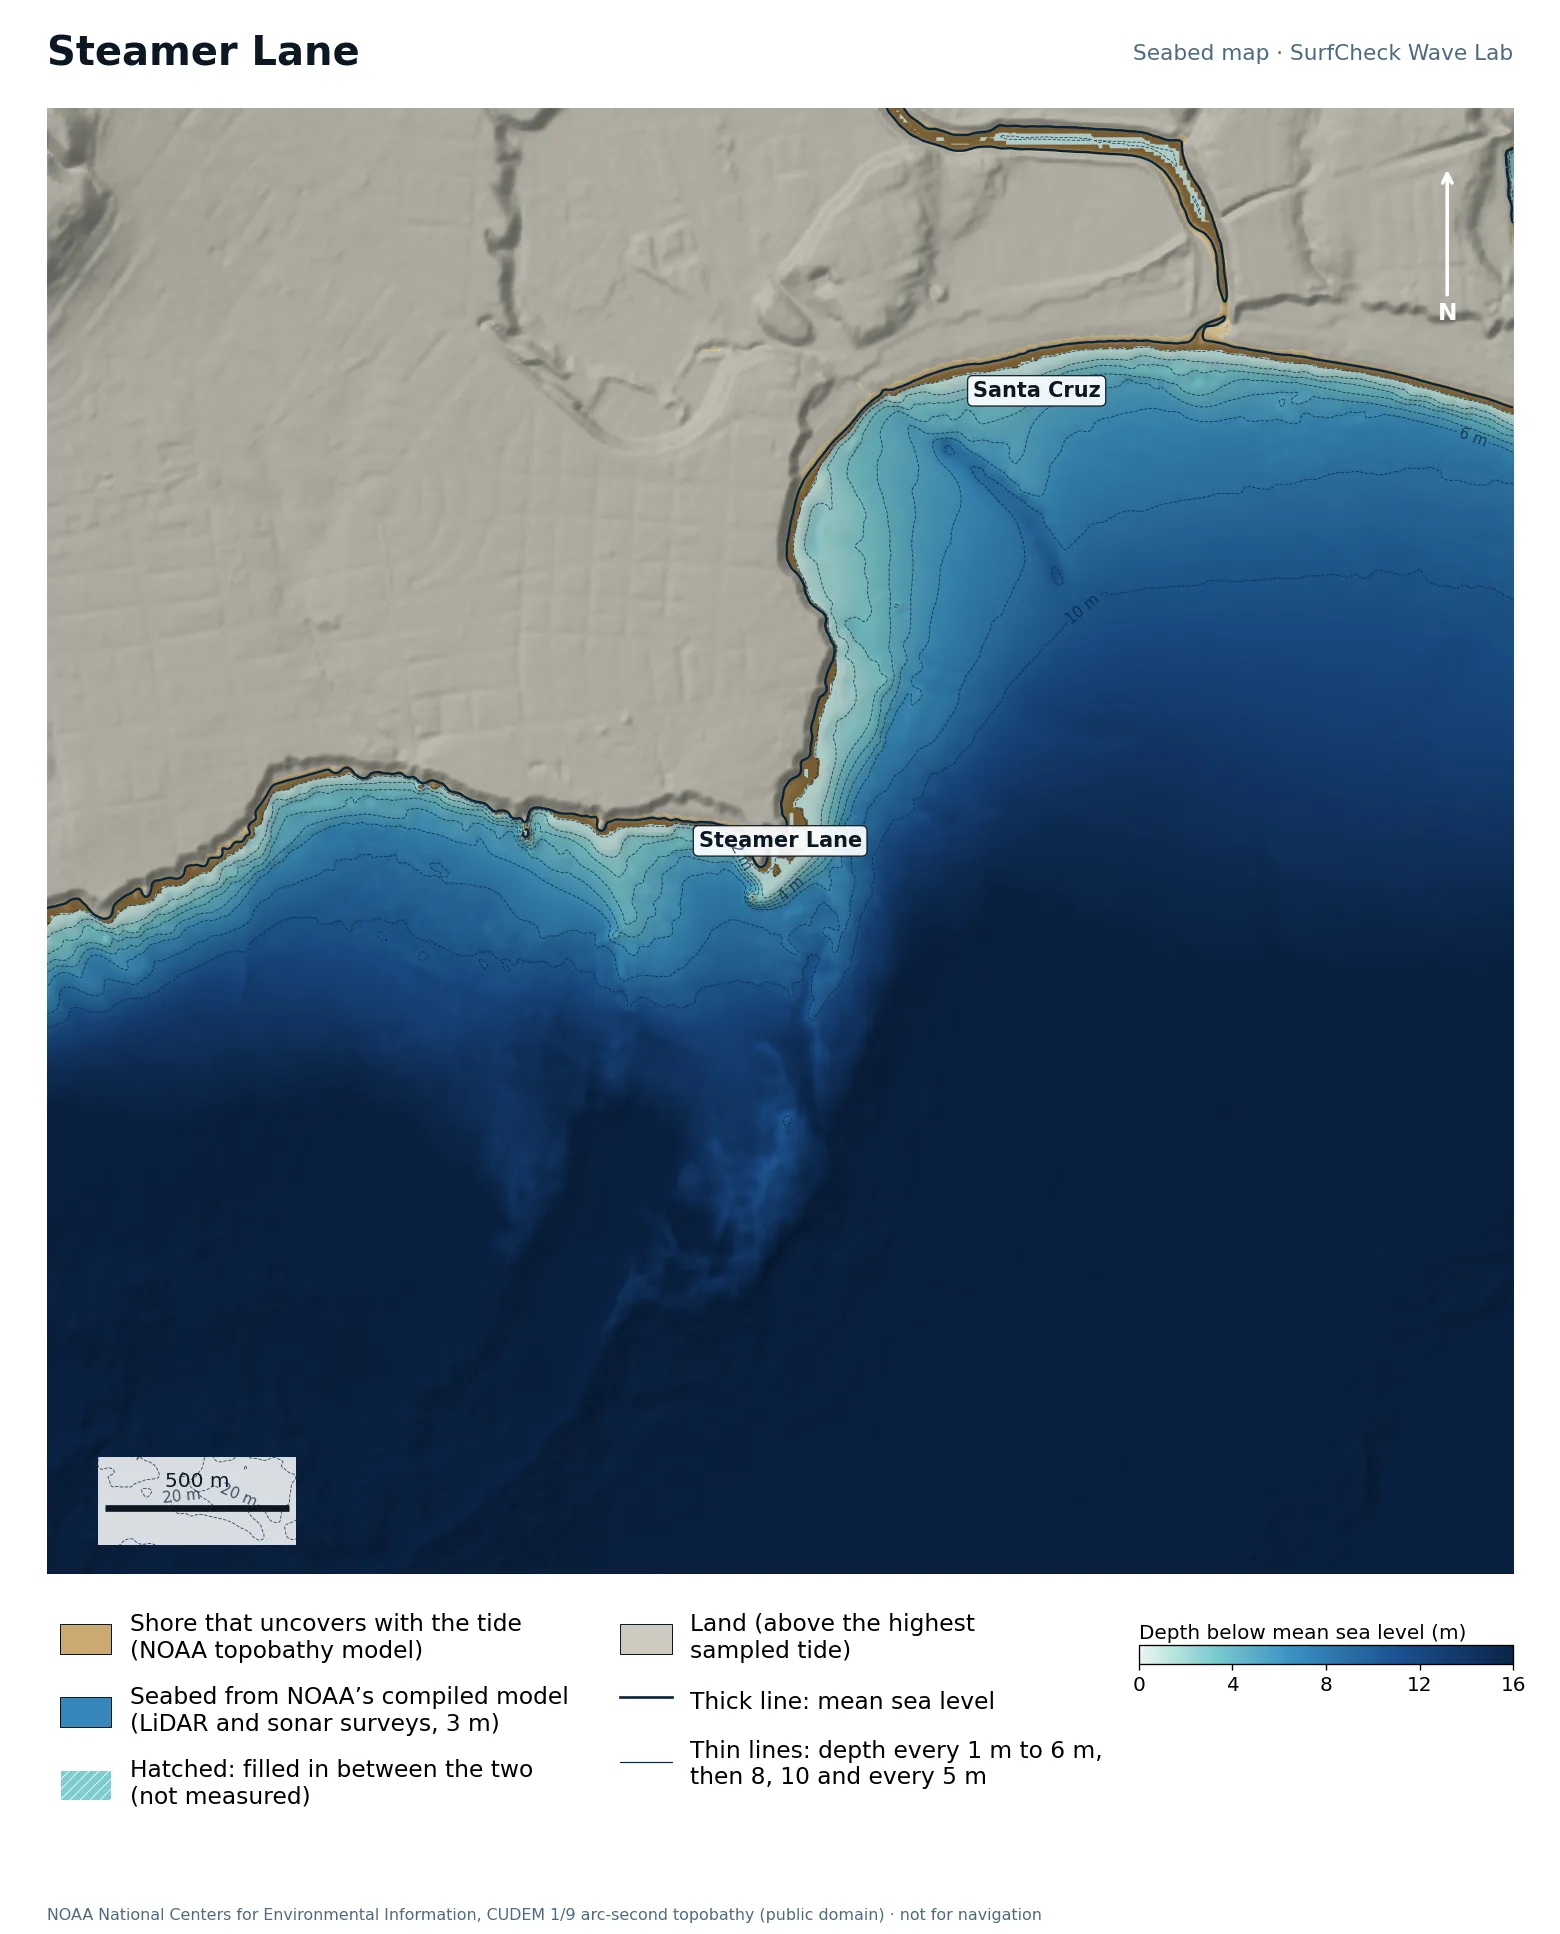
Seabed map of Steamer Lane: depth contours, the reef or beach that uncovers with the tide, and which parts are measuredClose-up of Steamer Lane in finer detail
100%
of the sea here is from NOAA’s compiled model
21 ha
uncovers with the tide
3 m
model grid
None
filled-in band, typical width

What the seabed shows

Lighthouse Point at the north-west corner of Monterey Bay, with rock reef ledges running along the foot of the cliff into the bay.

How sure we are

The whole map is NOAA’s CUDEM topobathy model at about 3 m, compiled from airborne LiDAR and sonar surveys. It is a finished model: NOAA fills gaps itself and does not mark where, so nothing is hatched here even though some of it will be interpolated.

In the Wave Lab

Not ranked. The seabed here is a compiled model that does not say which depths were measured, so we do not publish a swell ranking from it.

Run it in the Wave Lab

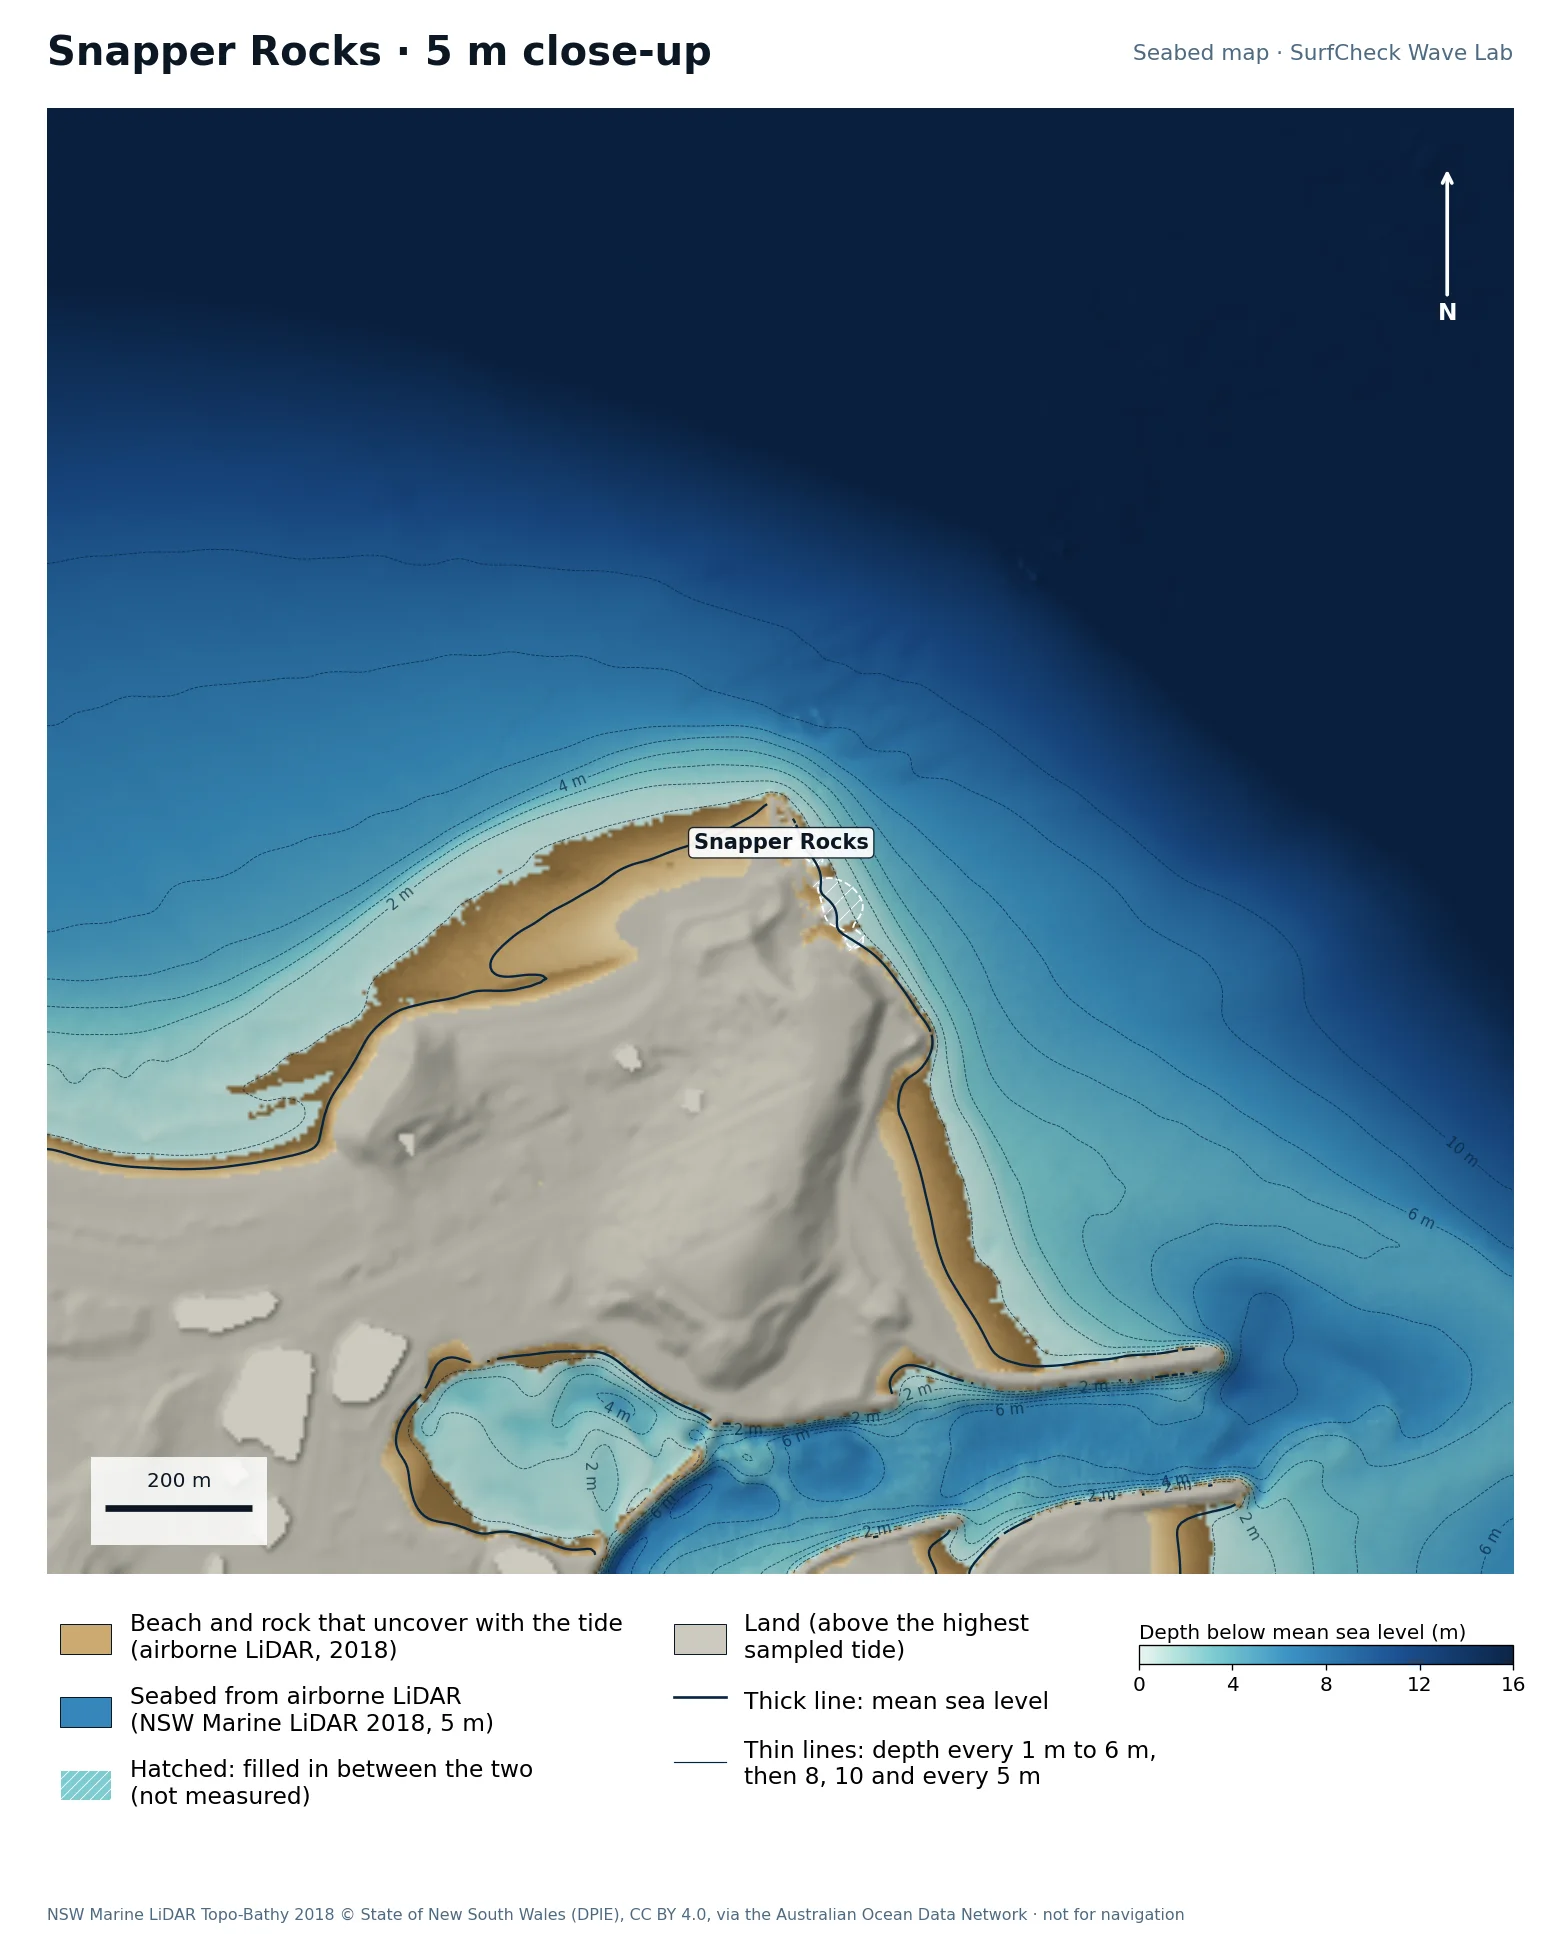
Gold Coast, Queensland · Start of the Superbank

Snapper Rocks

Well measured
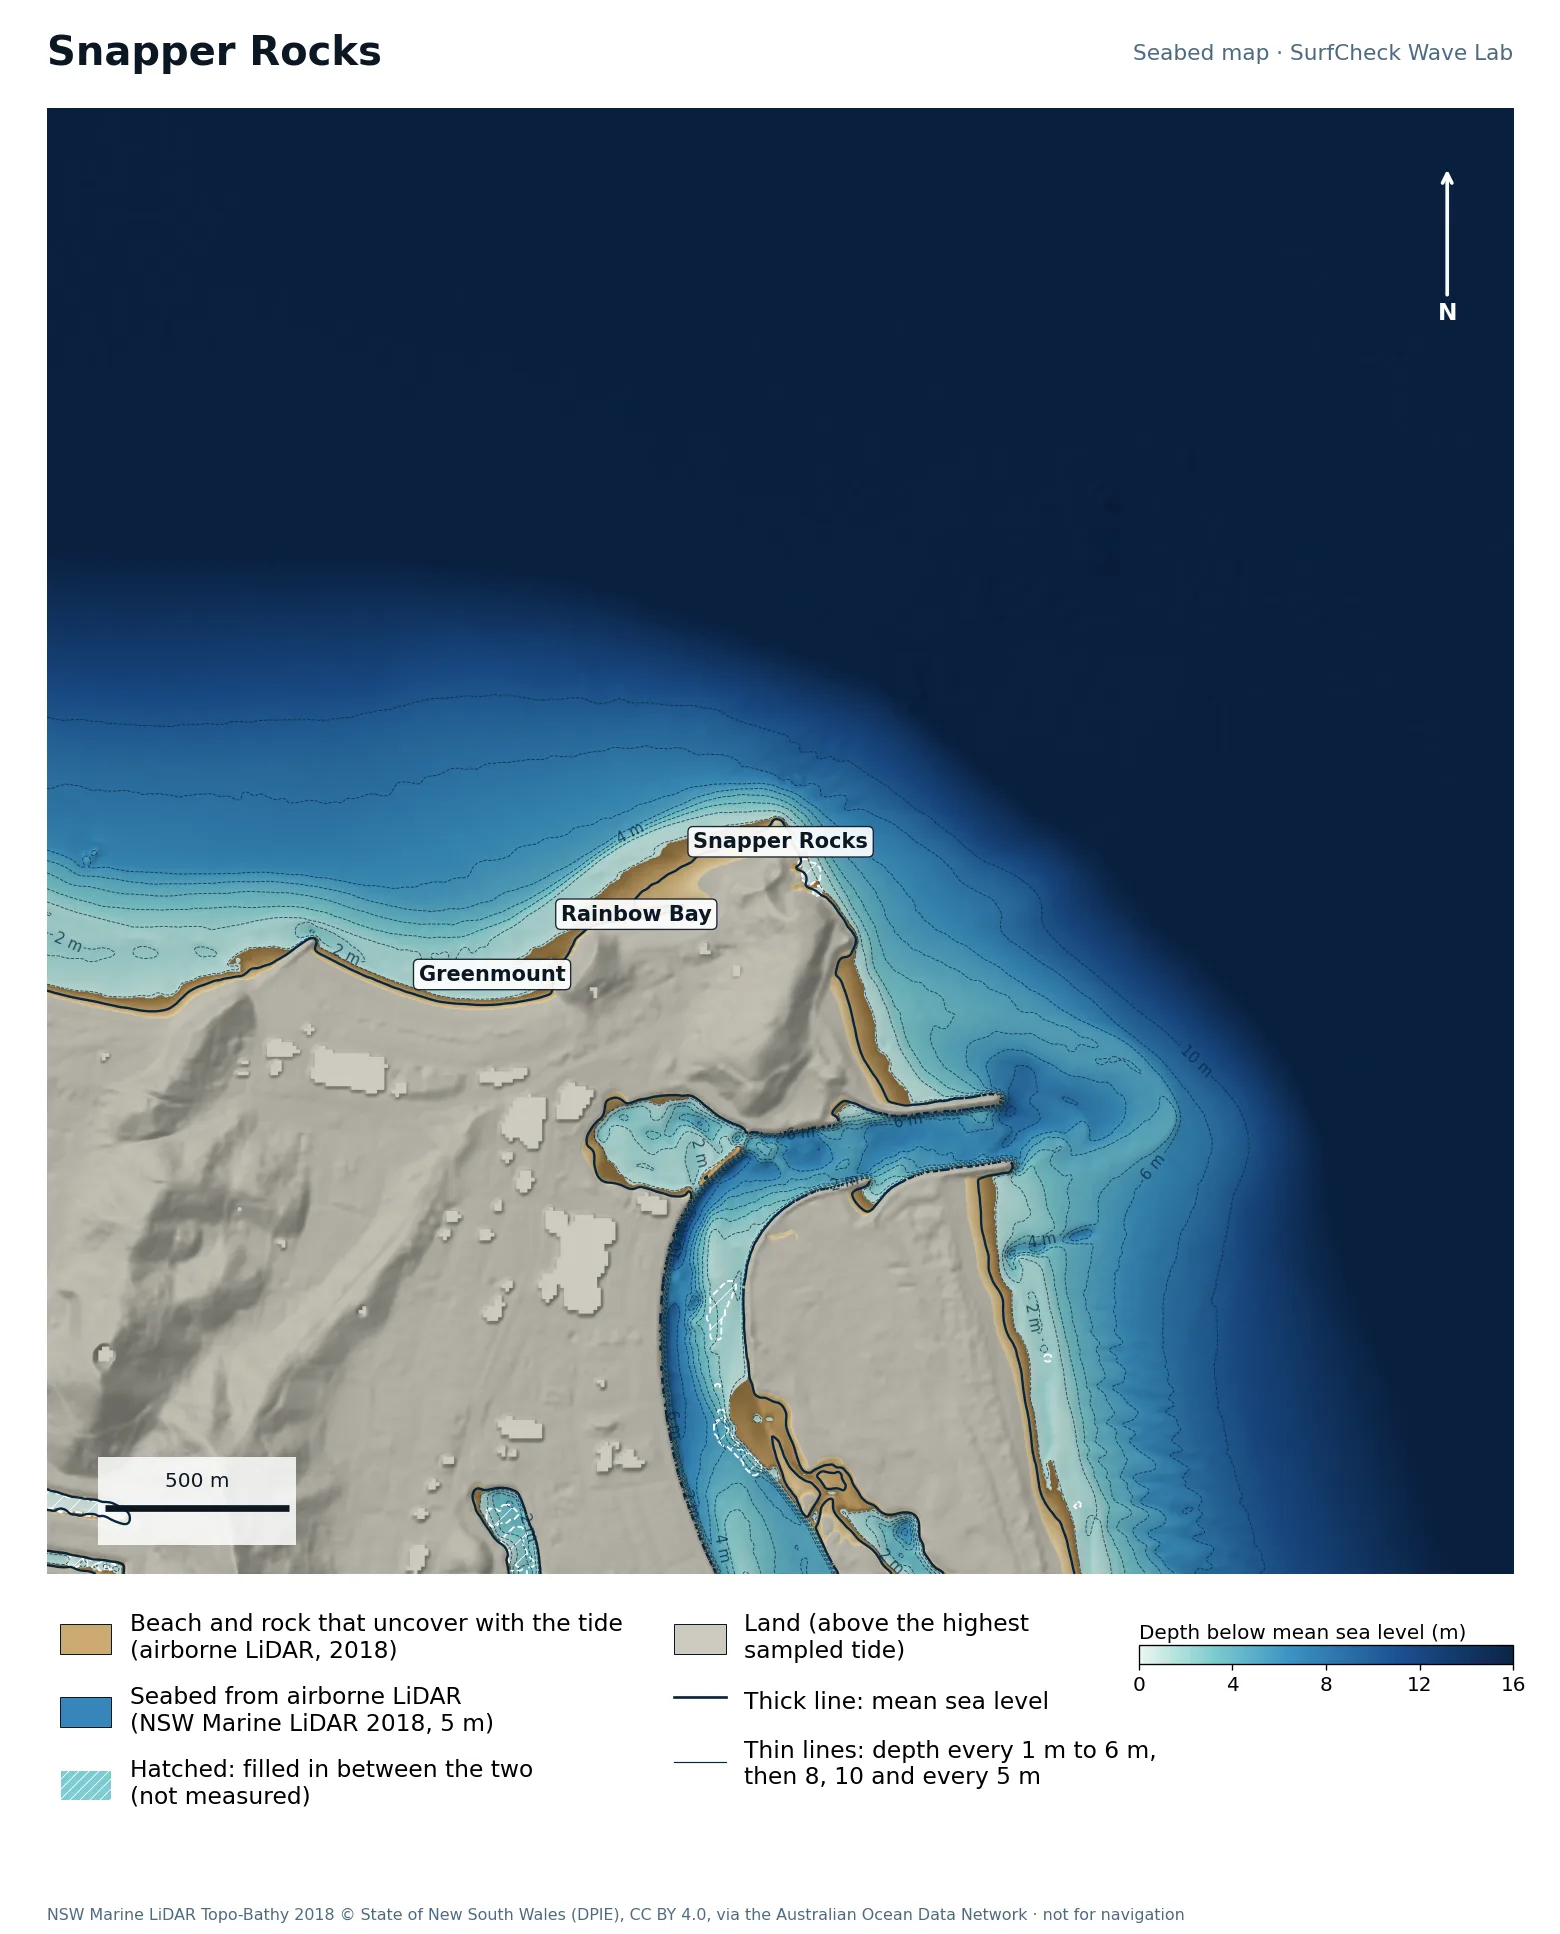
Seabed map of Snapper Rocks: depth contours, the reef or beach that uncovers with the tide, and which parts are measuredClose-up of Snapper Rocks in finer detail from LiDAR
100%
of the sea here is measured
36 ha
uncovers with the tide
5 m
airborne LiDAR, 2018
None
filled-in band, typical width

What the seabed shows

The rocks at Point Danger with a sand bank running west past Rainbow Bay and Greenmount. The Tweed River entrance and its training walls are just to the south; sand pumped from there feeds this bank.

How sure we are

100% of the sea in this map is measured. Beach and seabed both come from one airborne LiDAR survey flown in 2018, at 5 m, out to 20 to 40 m depth. Sand has moved since.

In the Wave Lab

Not fussy about direction: a spread of 6% across the range, which is too close to call. Tested for swell from 40° to 120°, with the seabed turned to face each direction.

Run it in the Wave Lab

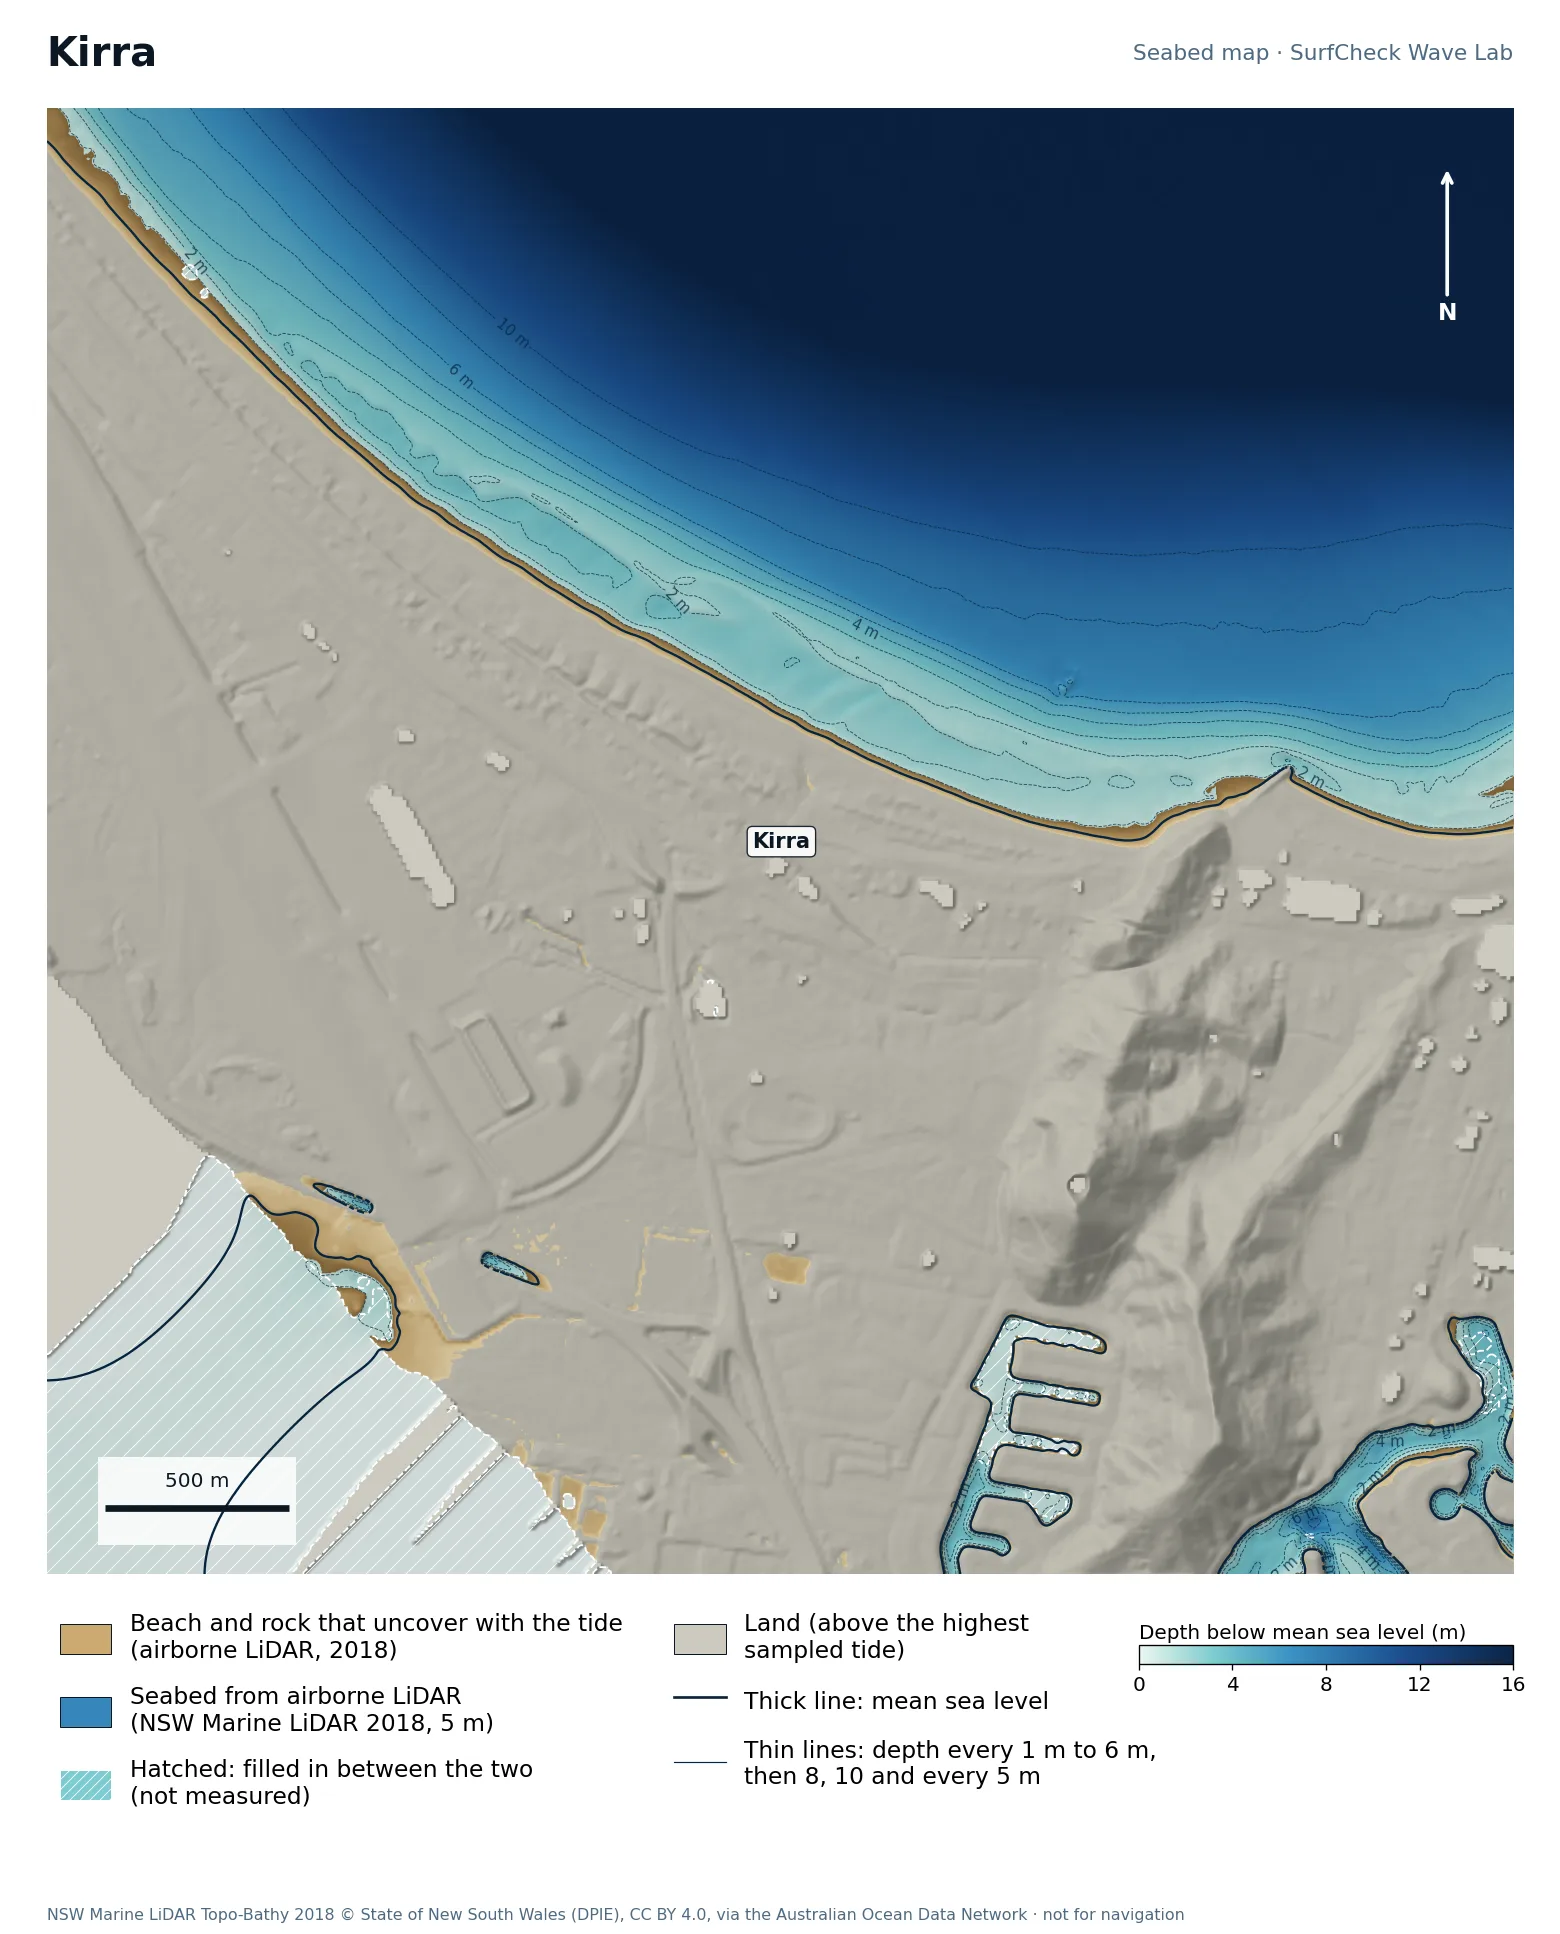
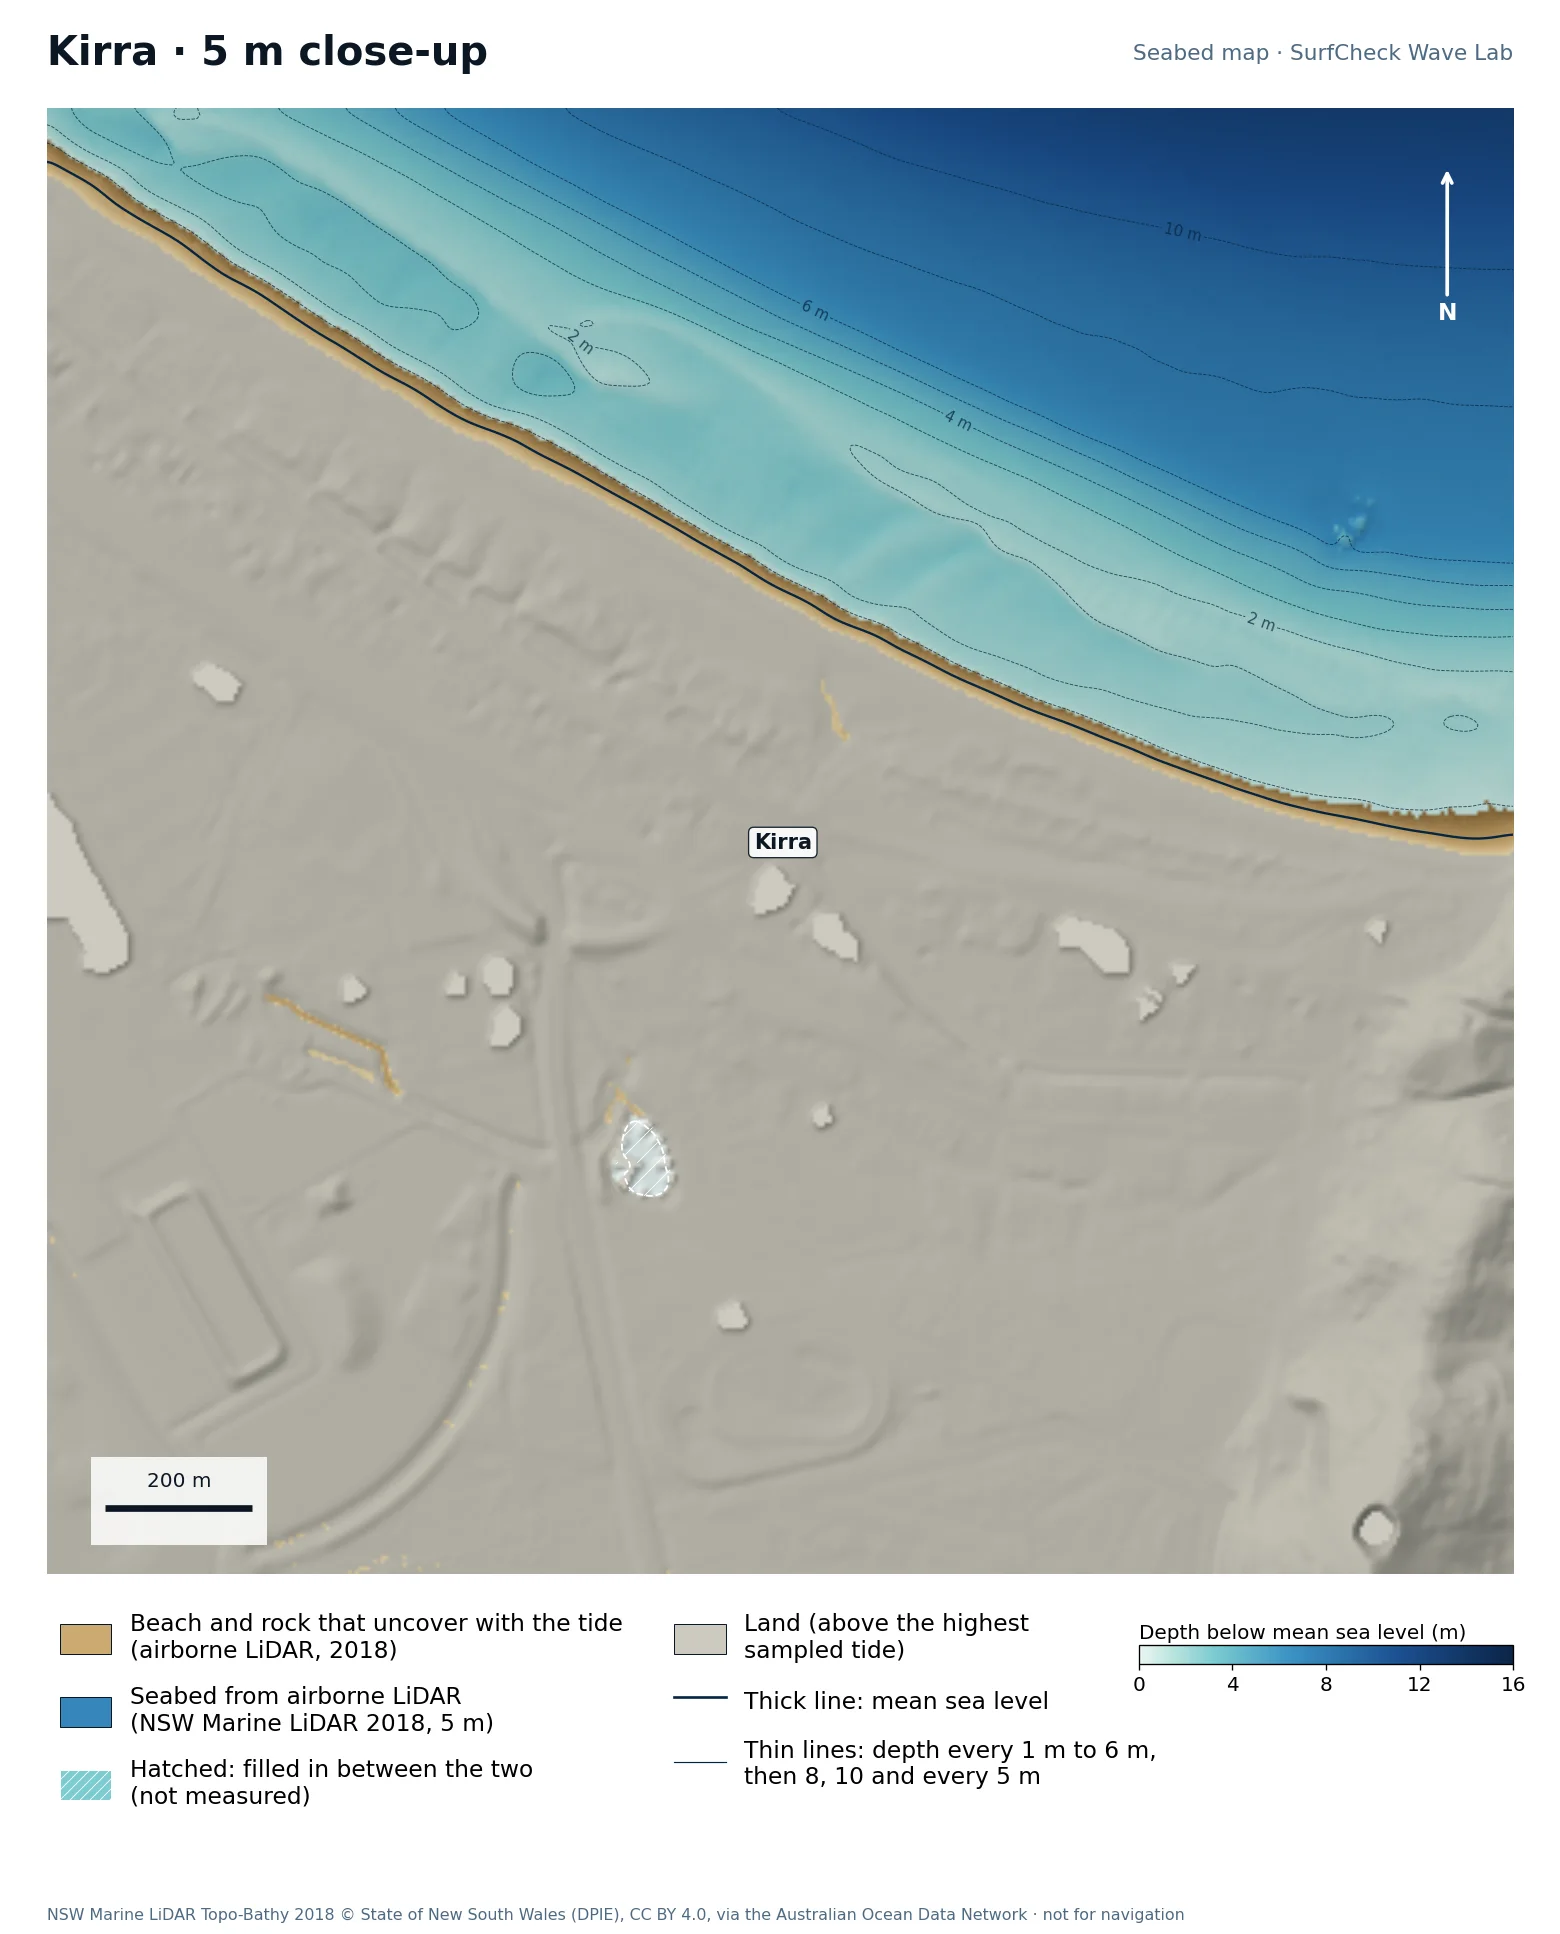
Gold Coast, Queensland · Sand-bottom point

Kirra

Well measured
Seabed map of Kirra: depth contours, the reef or beach that uncovers with the tide, and which parts are measuredClose-up of Kirra in finer detail from LiDAR
86%
of the sea here is measured
43 ha
uncovers with the tide
5 m
airborne LiDAR, 2018
400 m
filled-in band, typical width

What the seabed shows

A long, straight bank along the beach west of Kirra Point. The contours run parallel to the shore, which is the shape that lets a wave run a long way.

How sure we are

86% of the sea in this map is measured. Beach and seabed both come from one airborne LiDAR survey flown in 2018, at 5 m, out to 20 to 40 m depth. Sand has moved since. The gaps are in the creek and canals behind the beach, not in the surf.

In the Wave Lab

Not fussy about direction: a spread of 12% across the range, which is too close to call. Tested for swell from 30° to 70°, with the seabed turned to face each direction.

Run it in the Wave Lab

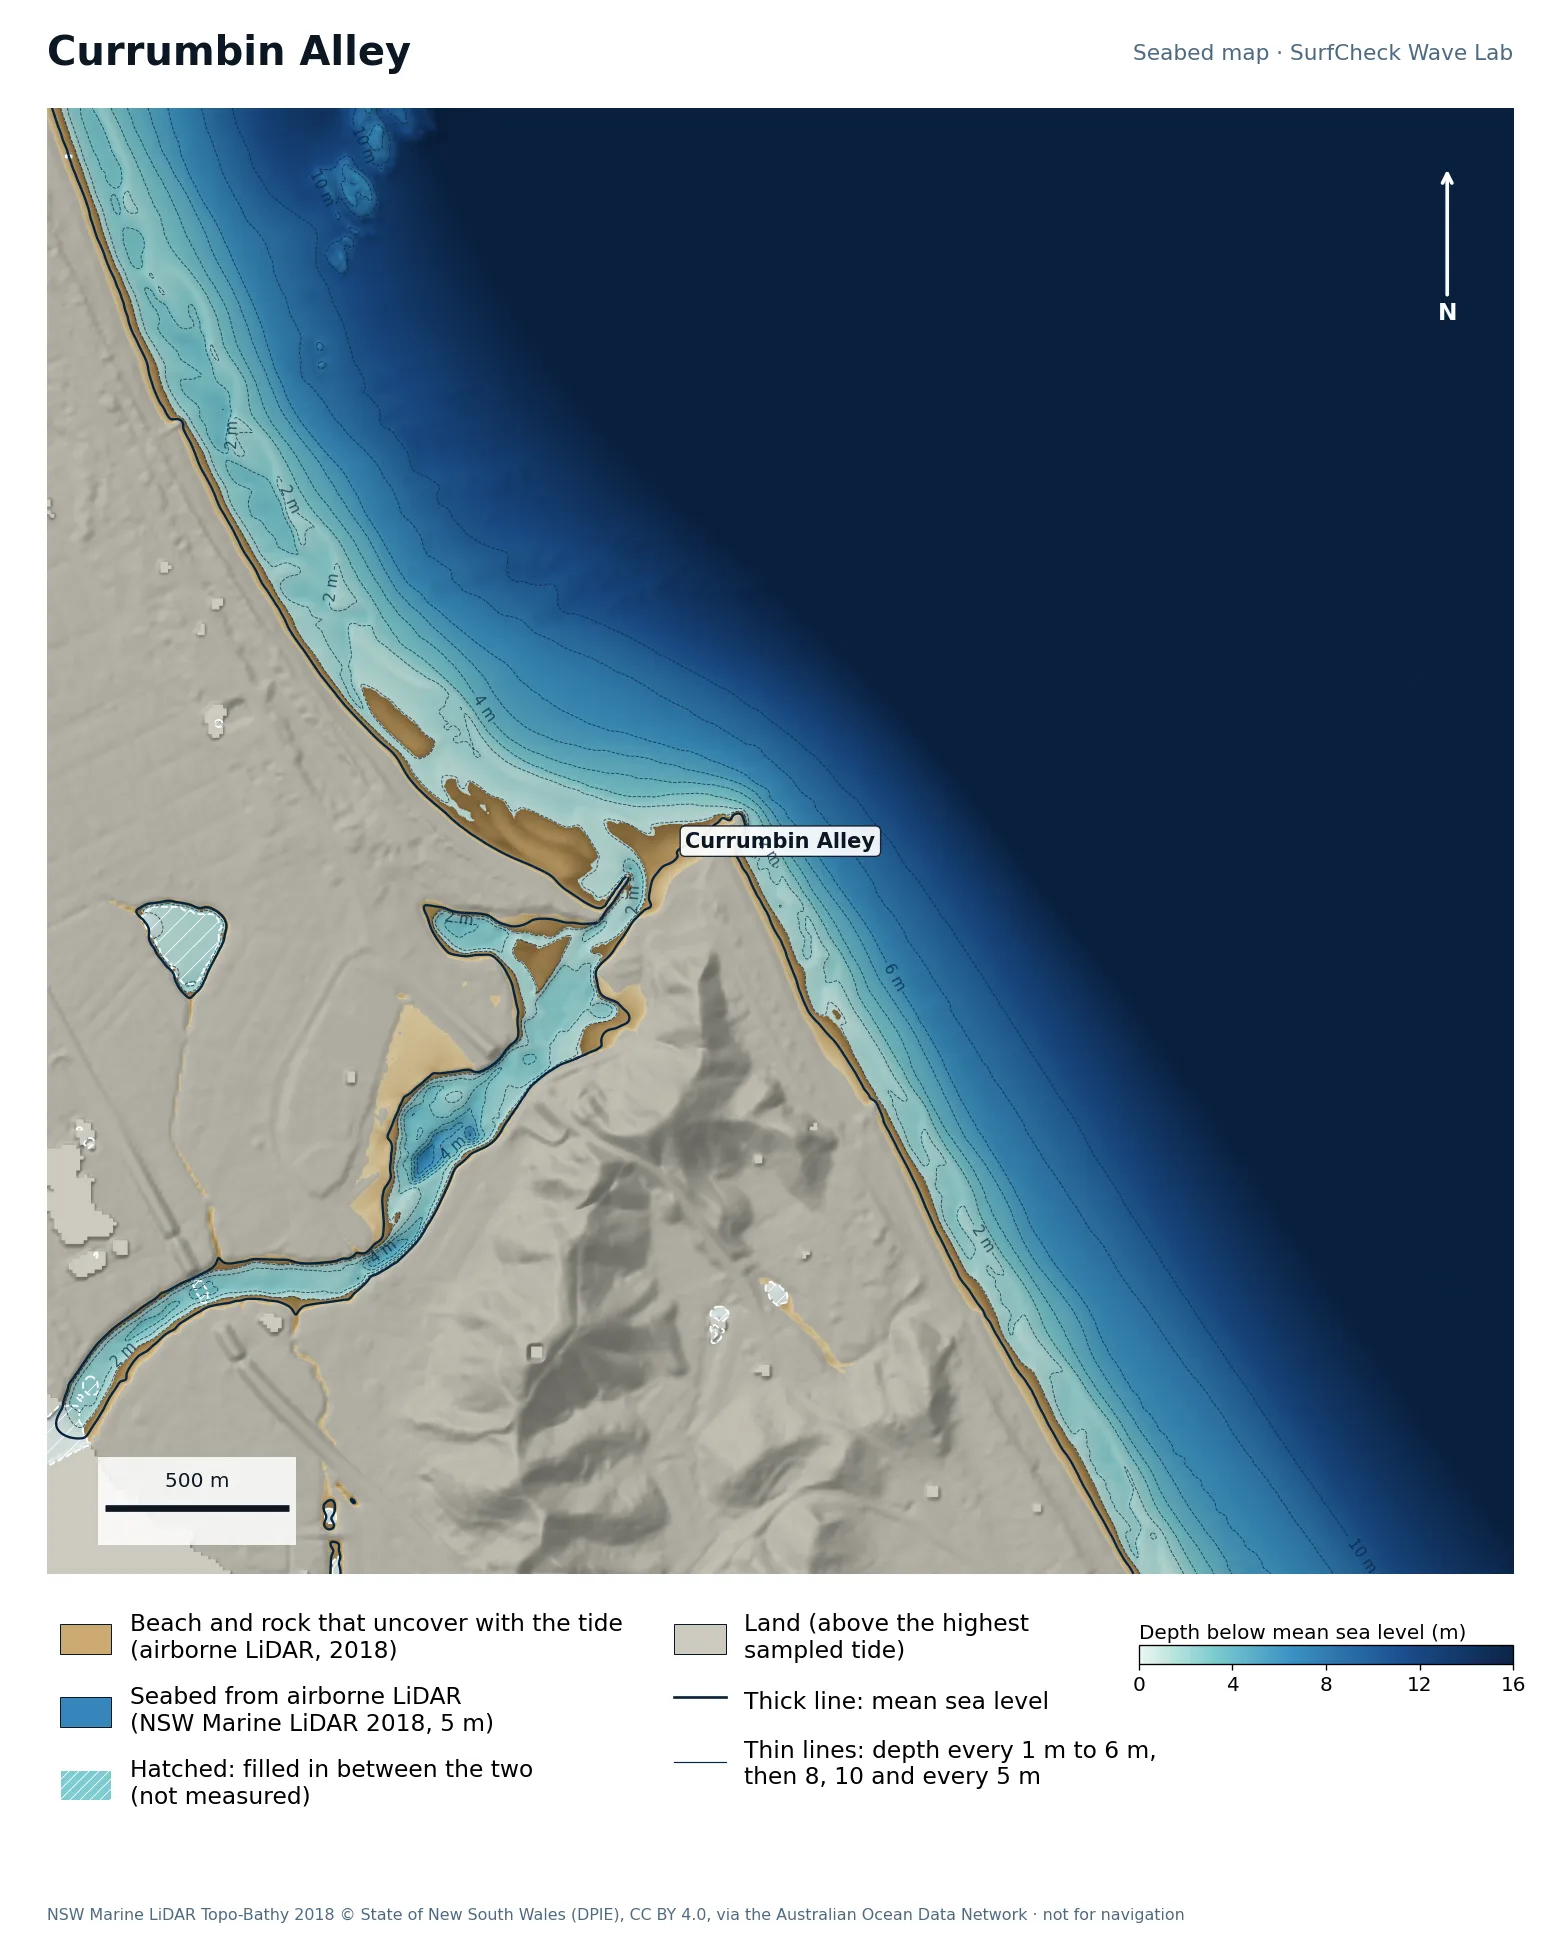
Gold Coast, Queensland · Point at a creek mouth

Currumbin Alley

Well measured
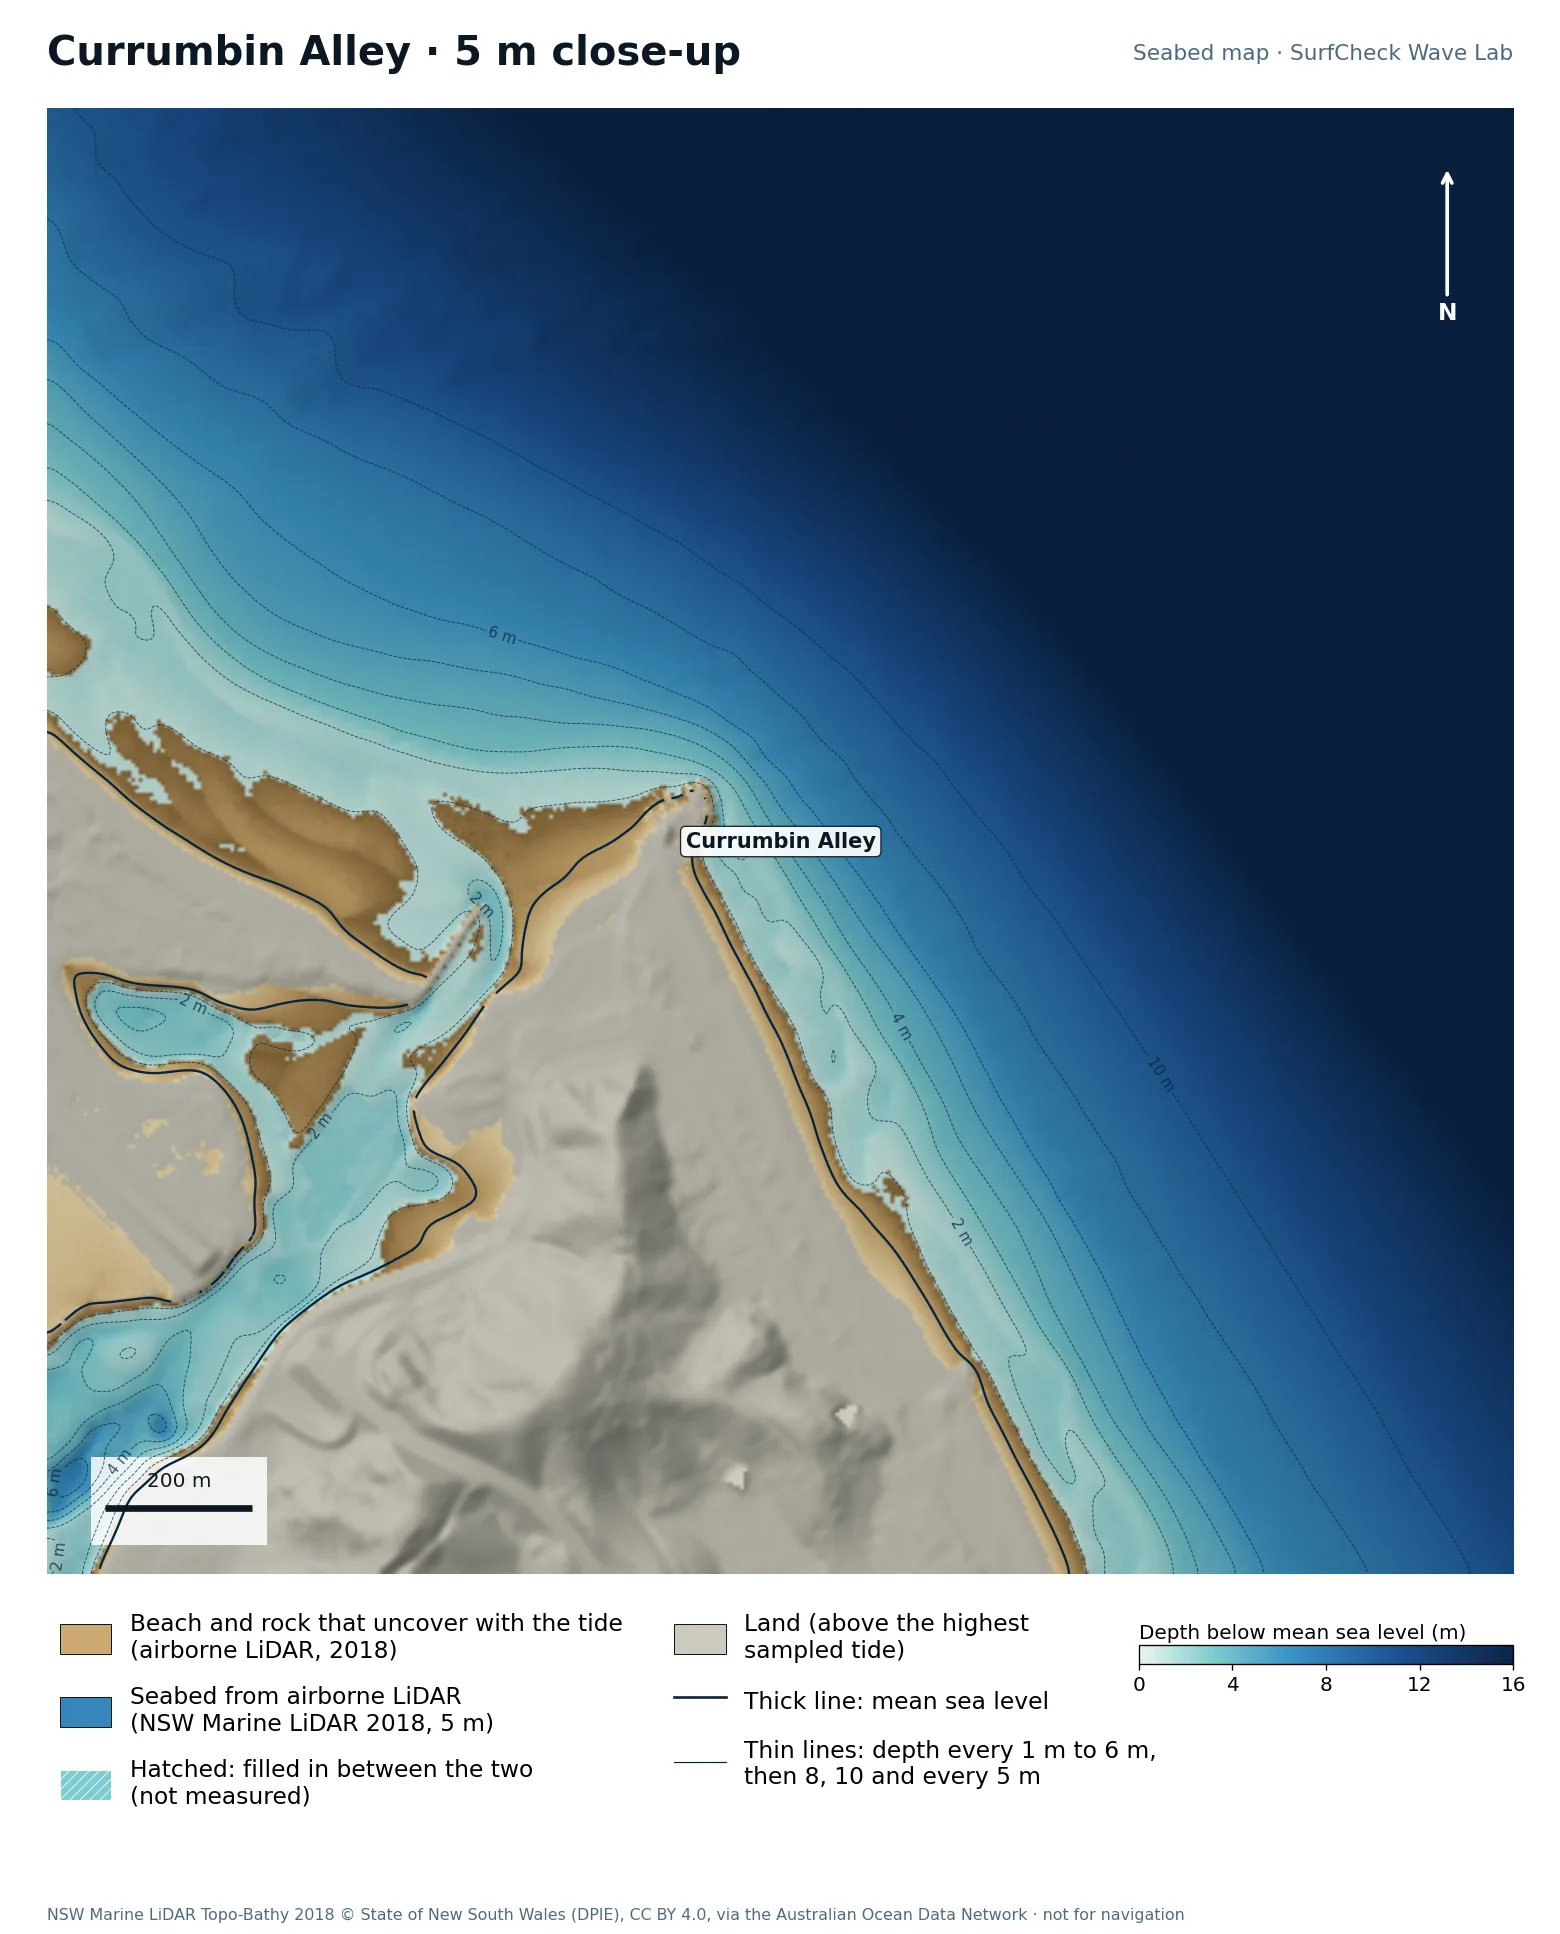
Seabed map of Currumbin Alley: depth contours, the reef or beach that uncovers with the tide, and which parts are measuredClose-up of Currumbin Alley in finer detail from LiDAR
99%
of the sea here is measured
51 ha
uncovers with the tide
5 m
airborne LiDAR, 2018
None
filled-in band, typical width

What the seabed shows

Currumbin Rock beside the creek entrance, with the bar built by the creek running out from it.

How sure we are

99% of the sea in this map is measured. Beach and seabed both come from one airborne LiDAR survey flown in 2018, at 5 m, out to 20 to 40 m depth. Sand has moved since.

In the Wave Lab

Biggest on swell from roughly 30° (+9% against its own average) and smallest from 130° (-16%). Tested for swell from 10° to 130°, with the seabed turned to face each direction. Overlapping tests agree within about 2%.

Run it in the Wave Lab

Tweed Heads, New South Wales · Beach break beside river walls

Duranbah

Well measured
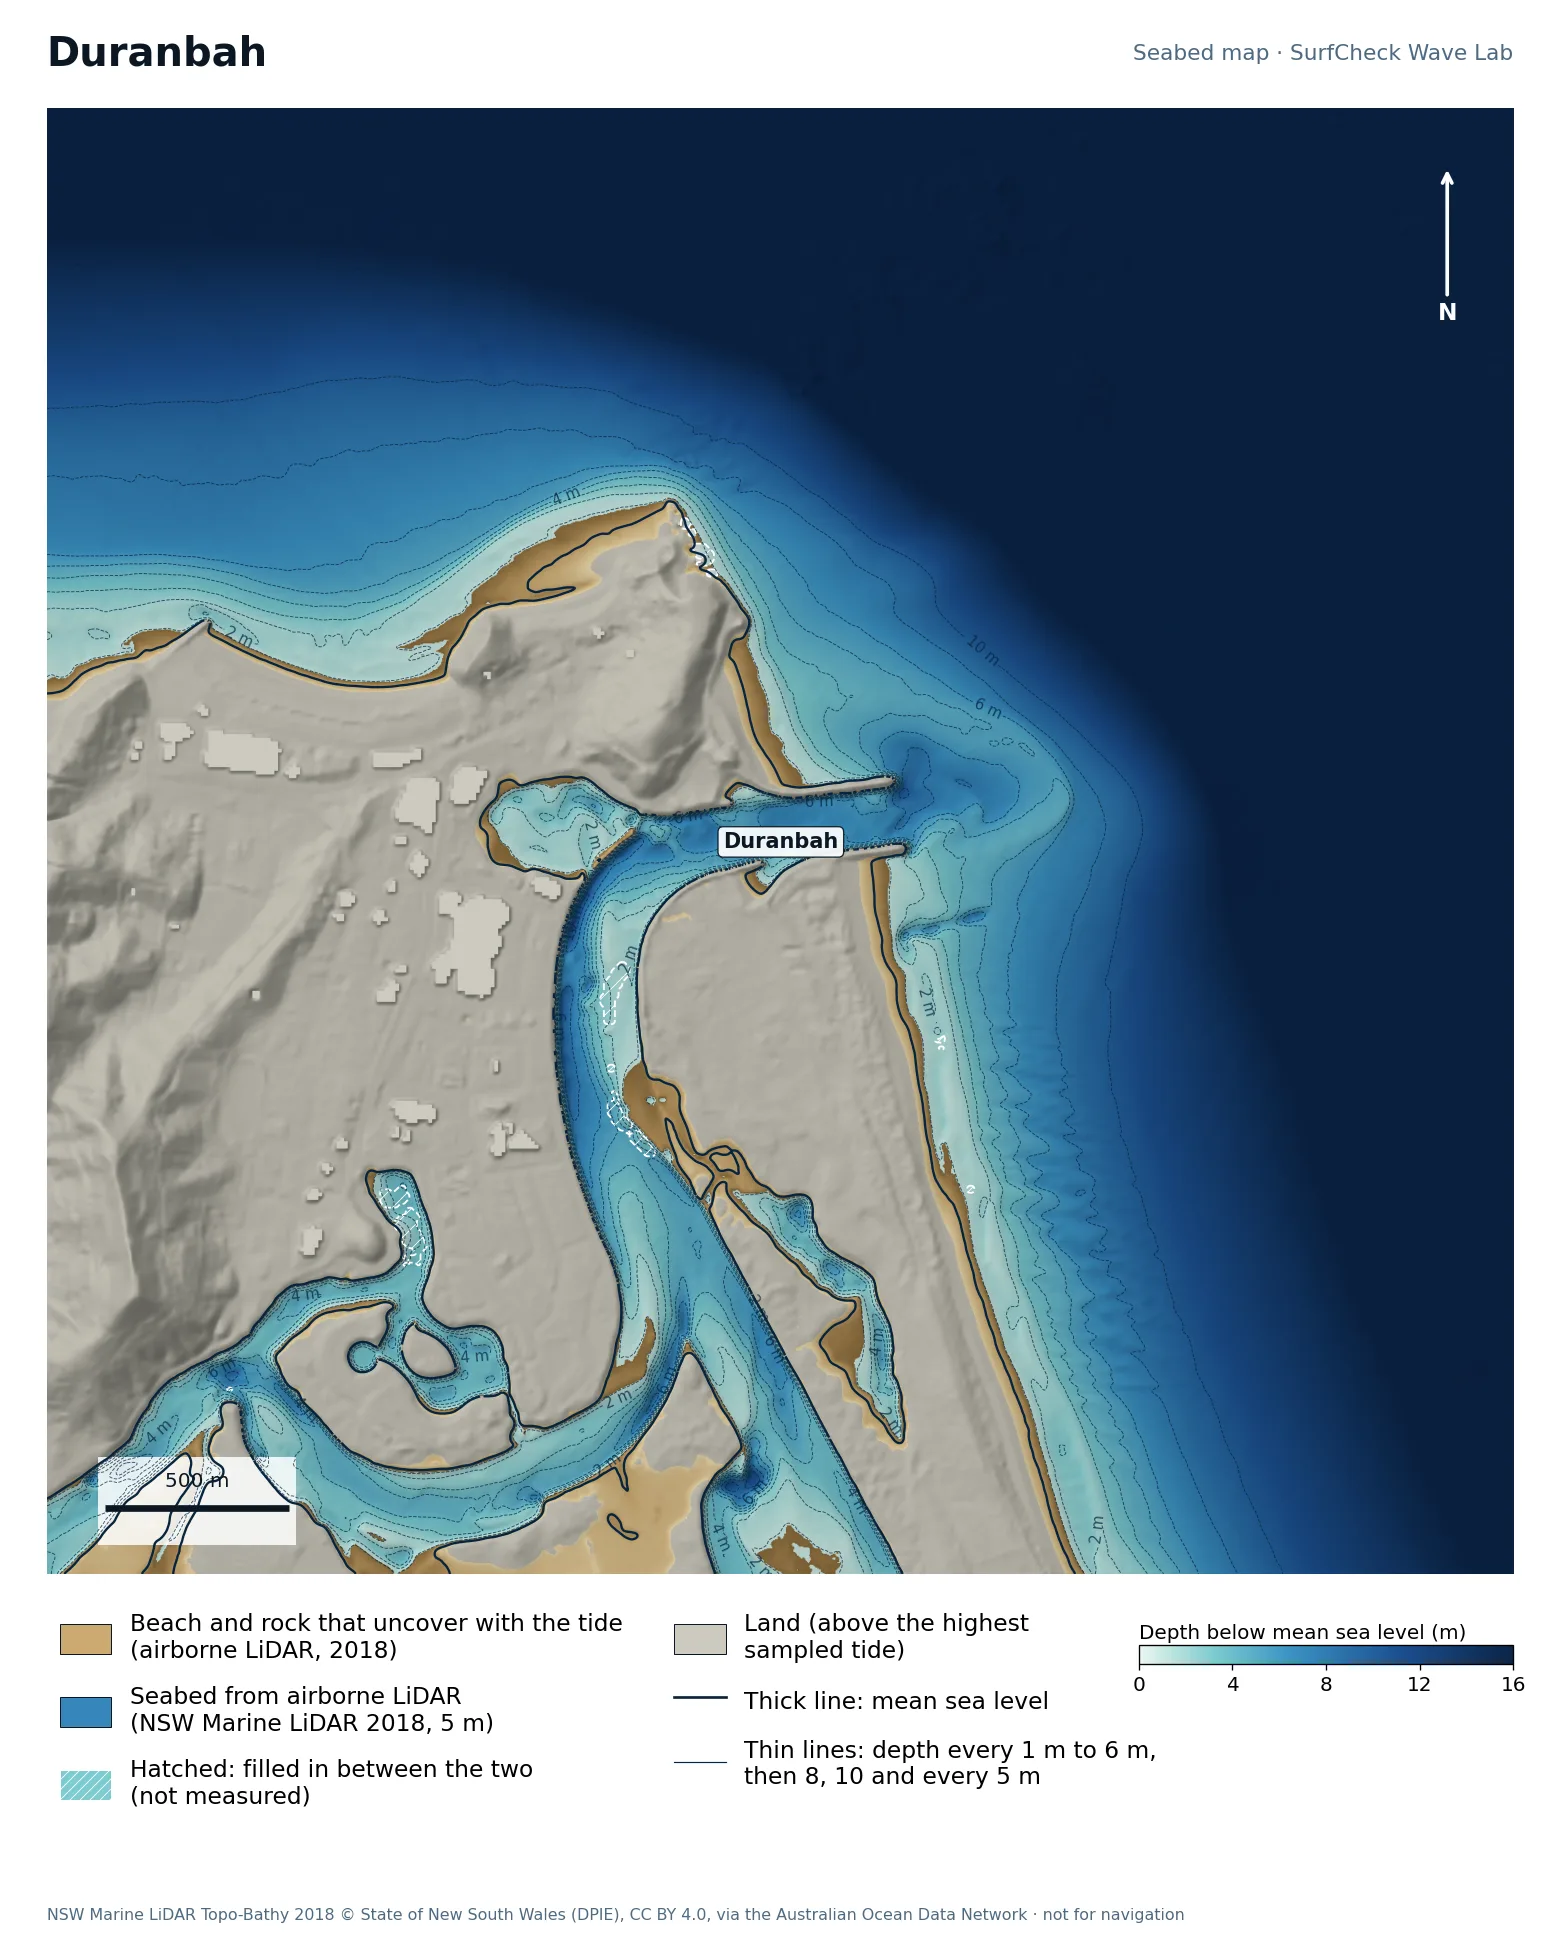
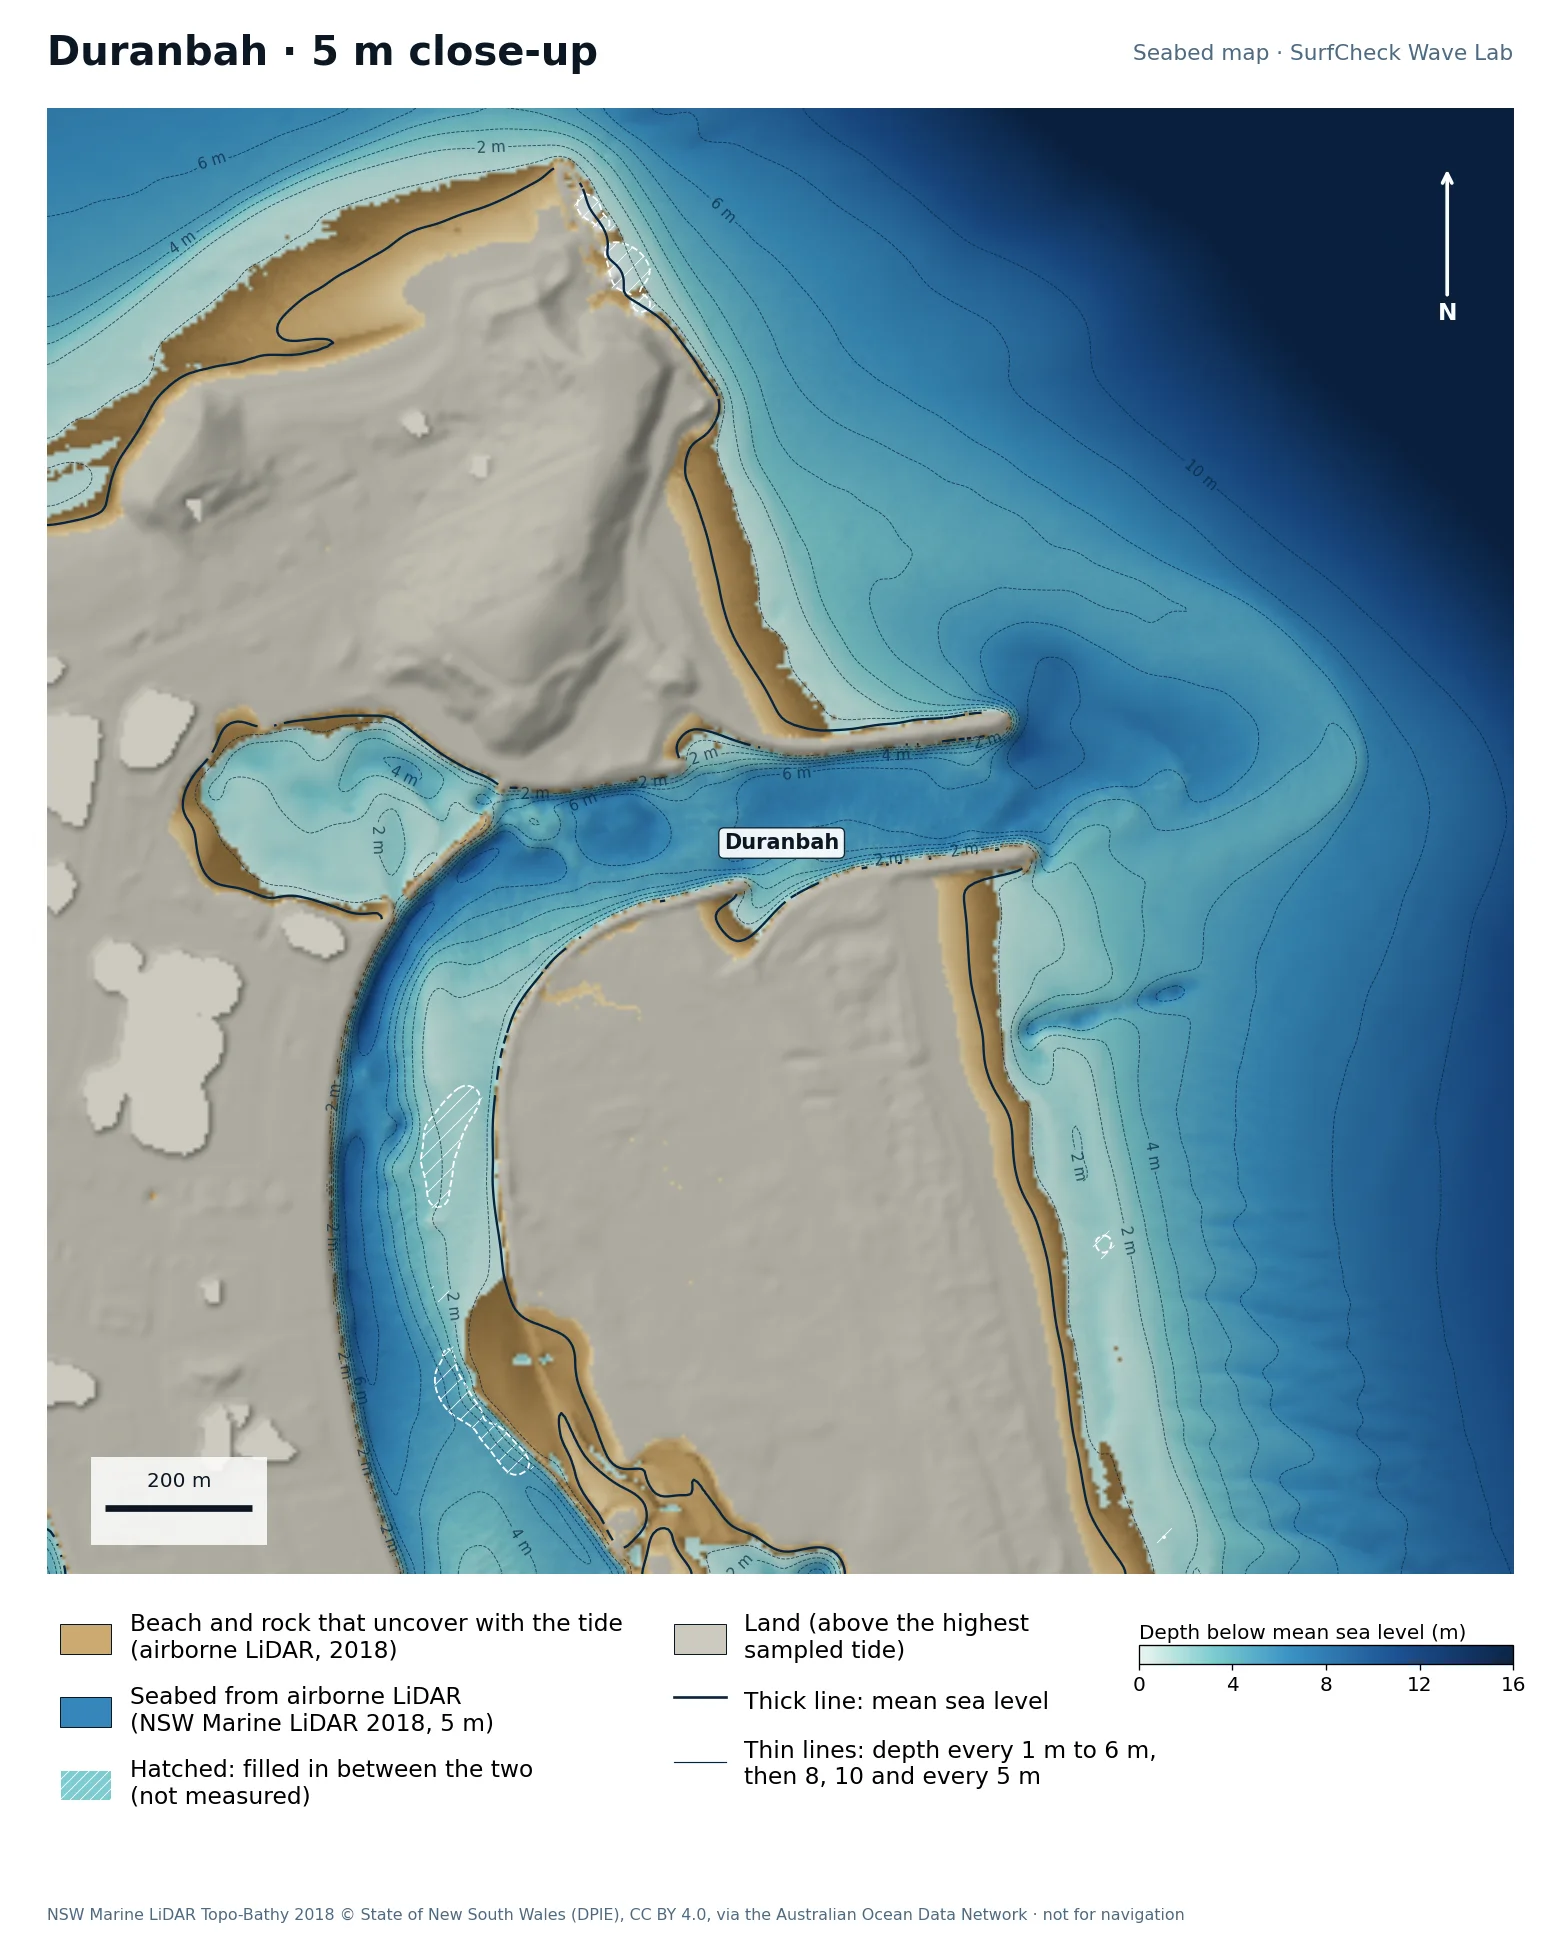
Seabed map of Duranbah: depth contours, the reef or beach that uncovers with the tide, and which parts are measuredClose-up of Duranbah in finer detail from LiDAR
100%
of the sea here is measured
72 ha
uncovers with the tide
5 m
airborne LiDAR, 2018
None
filled-in band, typical width

What the seabed shows

A short beach between Point Danger and the north training wall of the Tweed River. The river channel and its bar are plain on the map.

How sure we are

100% of the sea in this map is measured. Beach and seabed both come from one airborne LiDAR survey flown in 2018, at 5 m, out to 20 to 40 m depth. Sand has moved since.

In the Wave Lab

Swell direction is too close to call: the model cannot separate directions that differ by less than about 30% in breaker size. Tide changes breaker size by under 4%.

Run it in the Wave Lab

New South Wales · Headland point

Cabarita

Well measured
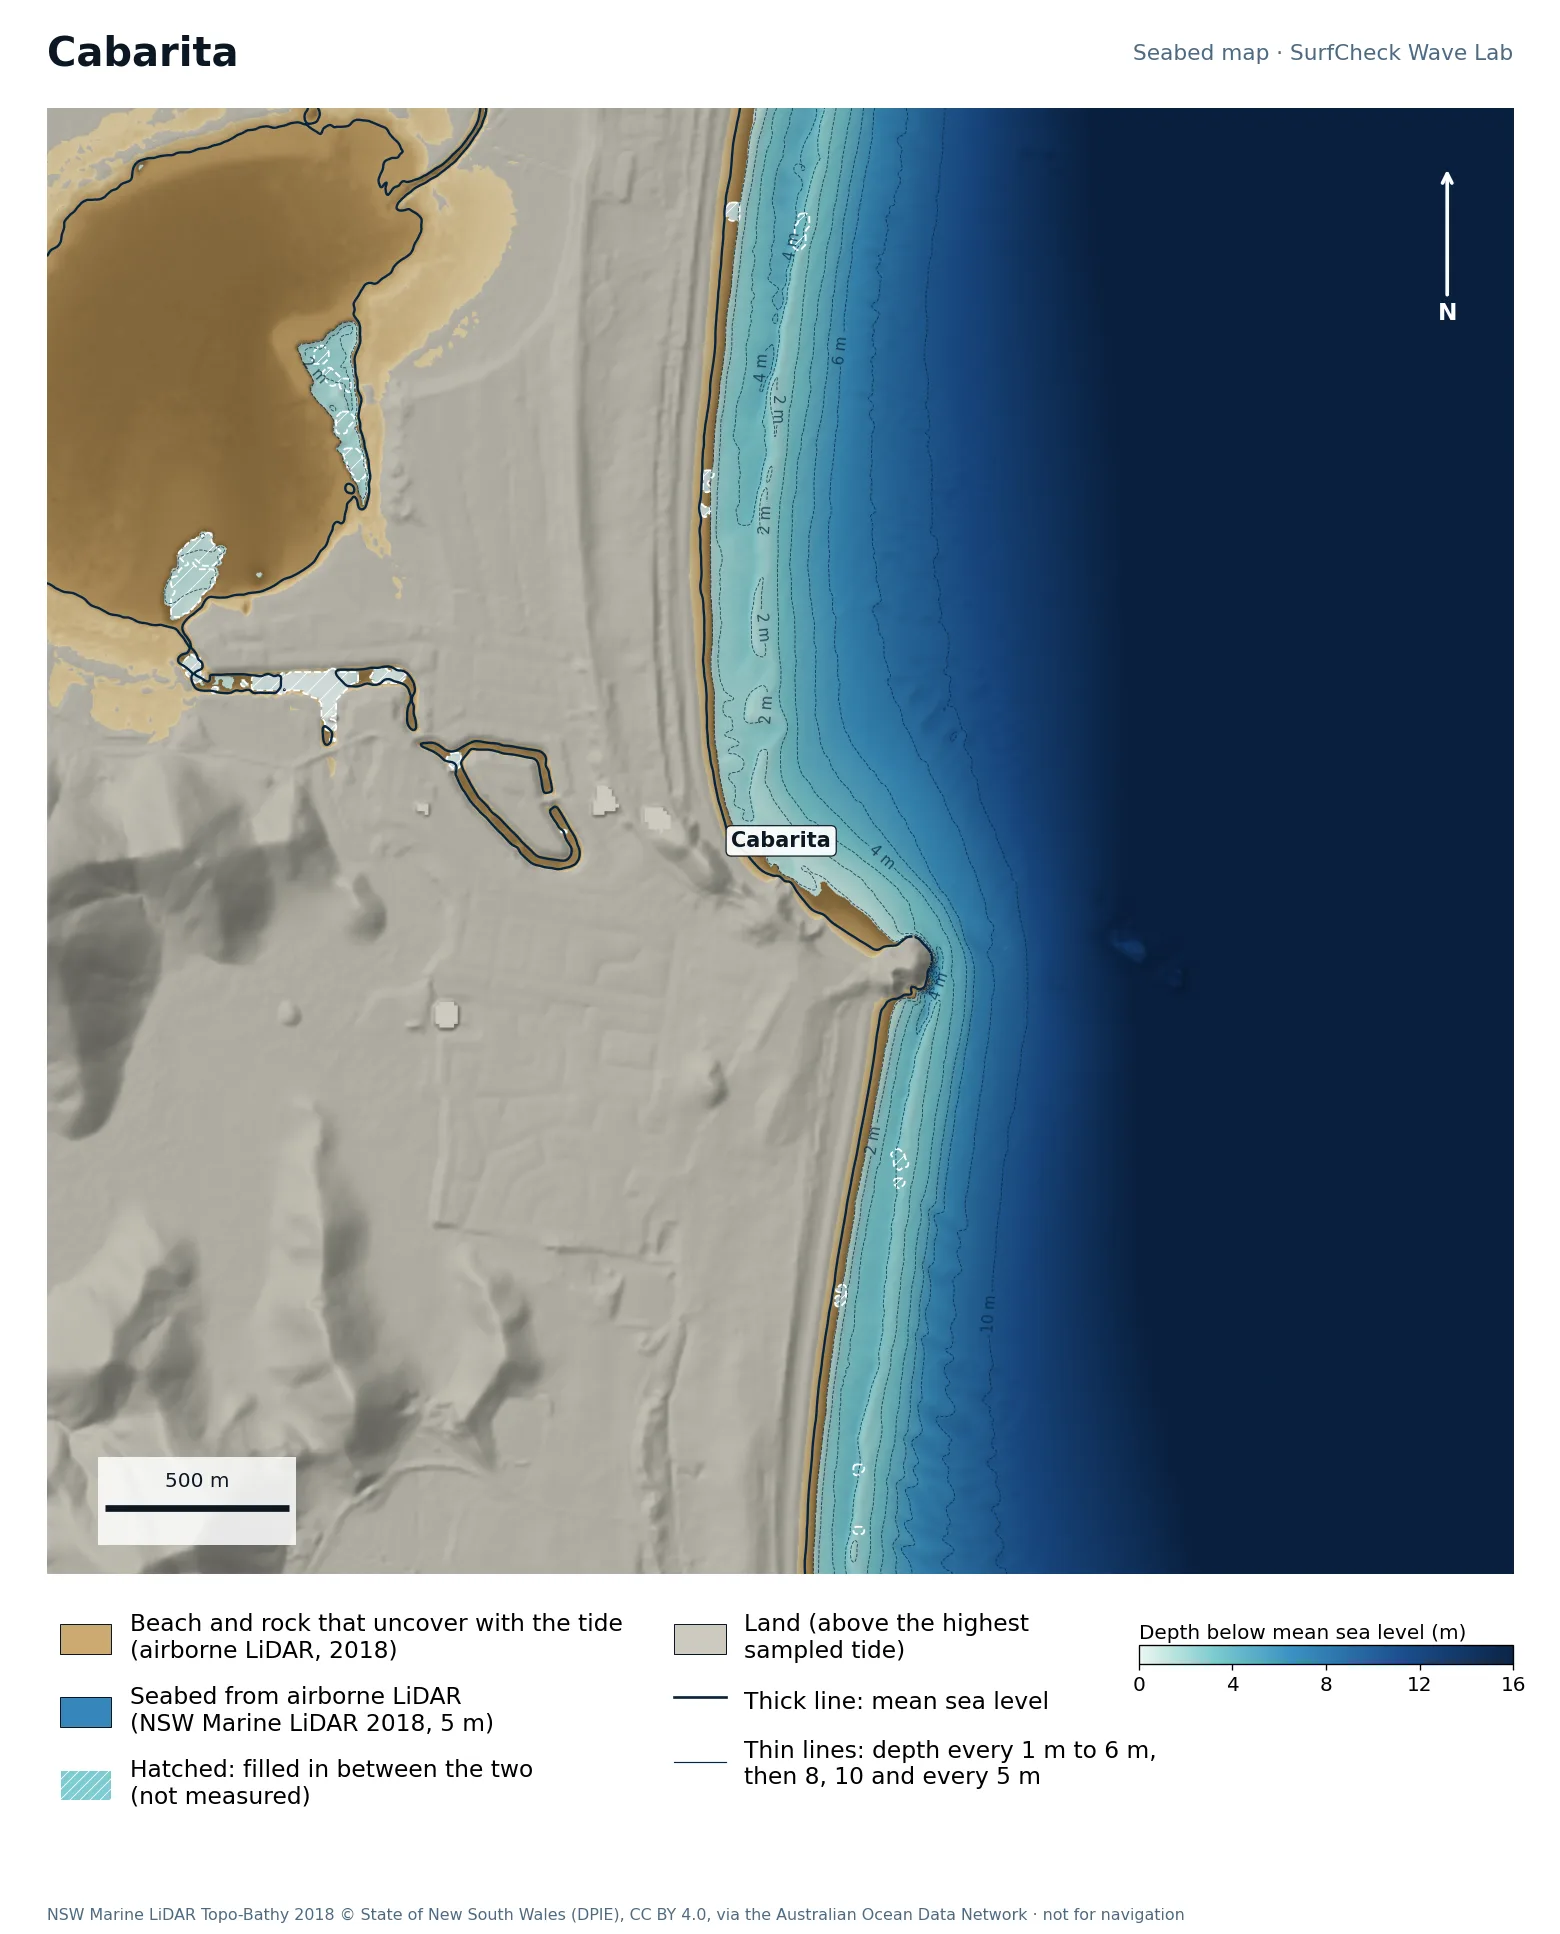
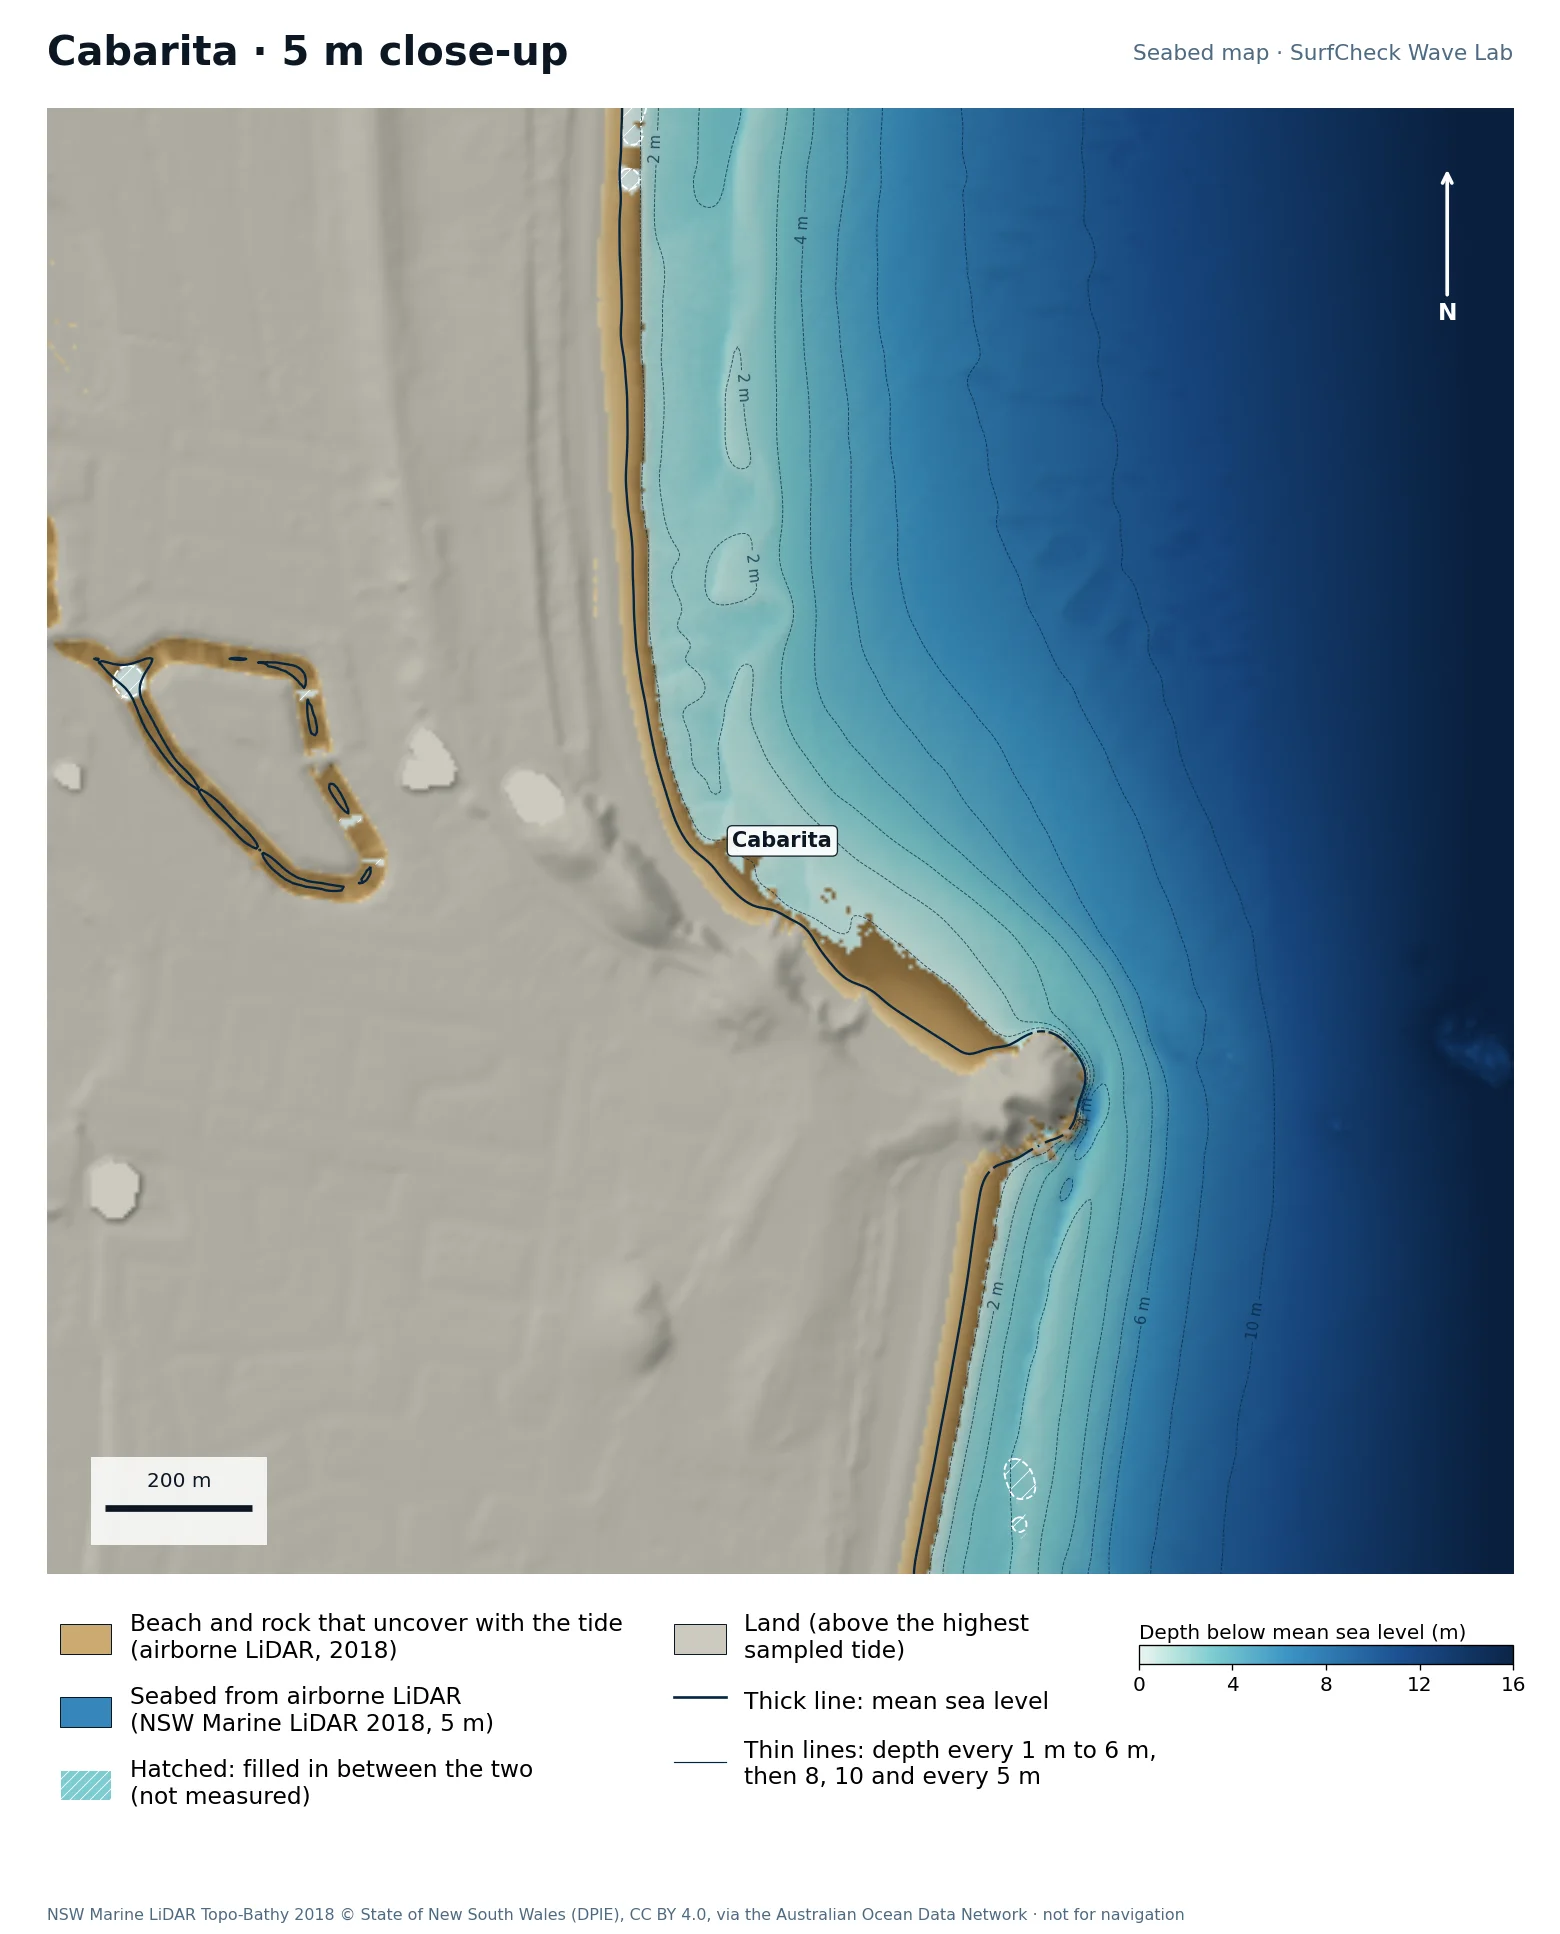
Seabed map of Cabarita: depth contours, the reef or beach that uncovers with the tide, and which parts are measuredClose-up of Cabarita in finer detail from LiDAR
99%
of the sea here is measured
167 ha
uncovers with the tide
5 m
airborne LiDAR, 2018
None
filled-in band, typical width

What the seabed shows

Norries Head with long beaches either side. The point is on the north side of the head.

How sure we are

99% of the sea in this map is measured. Beach and seabed both come from one airborne LiDAR survey flown in 2018, at 5 m, out to 20 to 40 m depth. Sand has moved since.

In the Wave Lab

Not fussy about direction: a spread of 19% across the range, which is too close to call. Tested for swell from 10° to 130°, with the seabed turned to face each direction.

Run it in the Wave Lab

New South Wales · Sheltered point inside a cape

Byron Bay · The Pass

Well measured
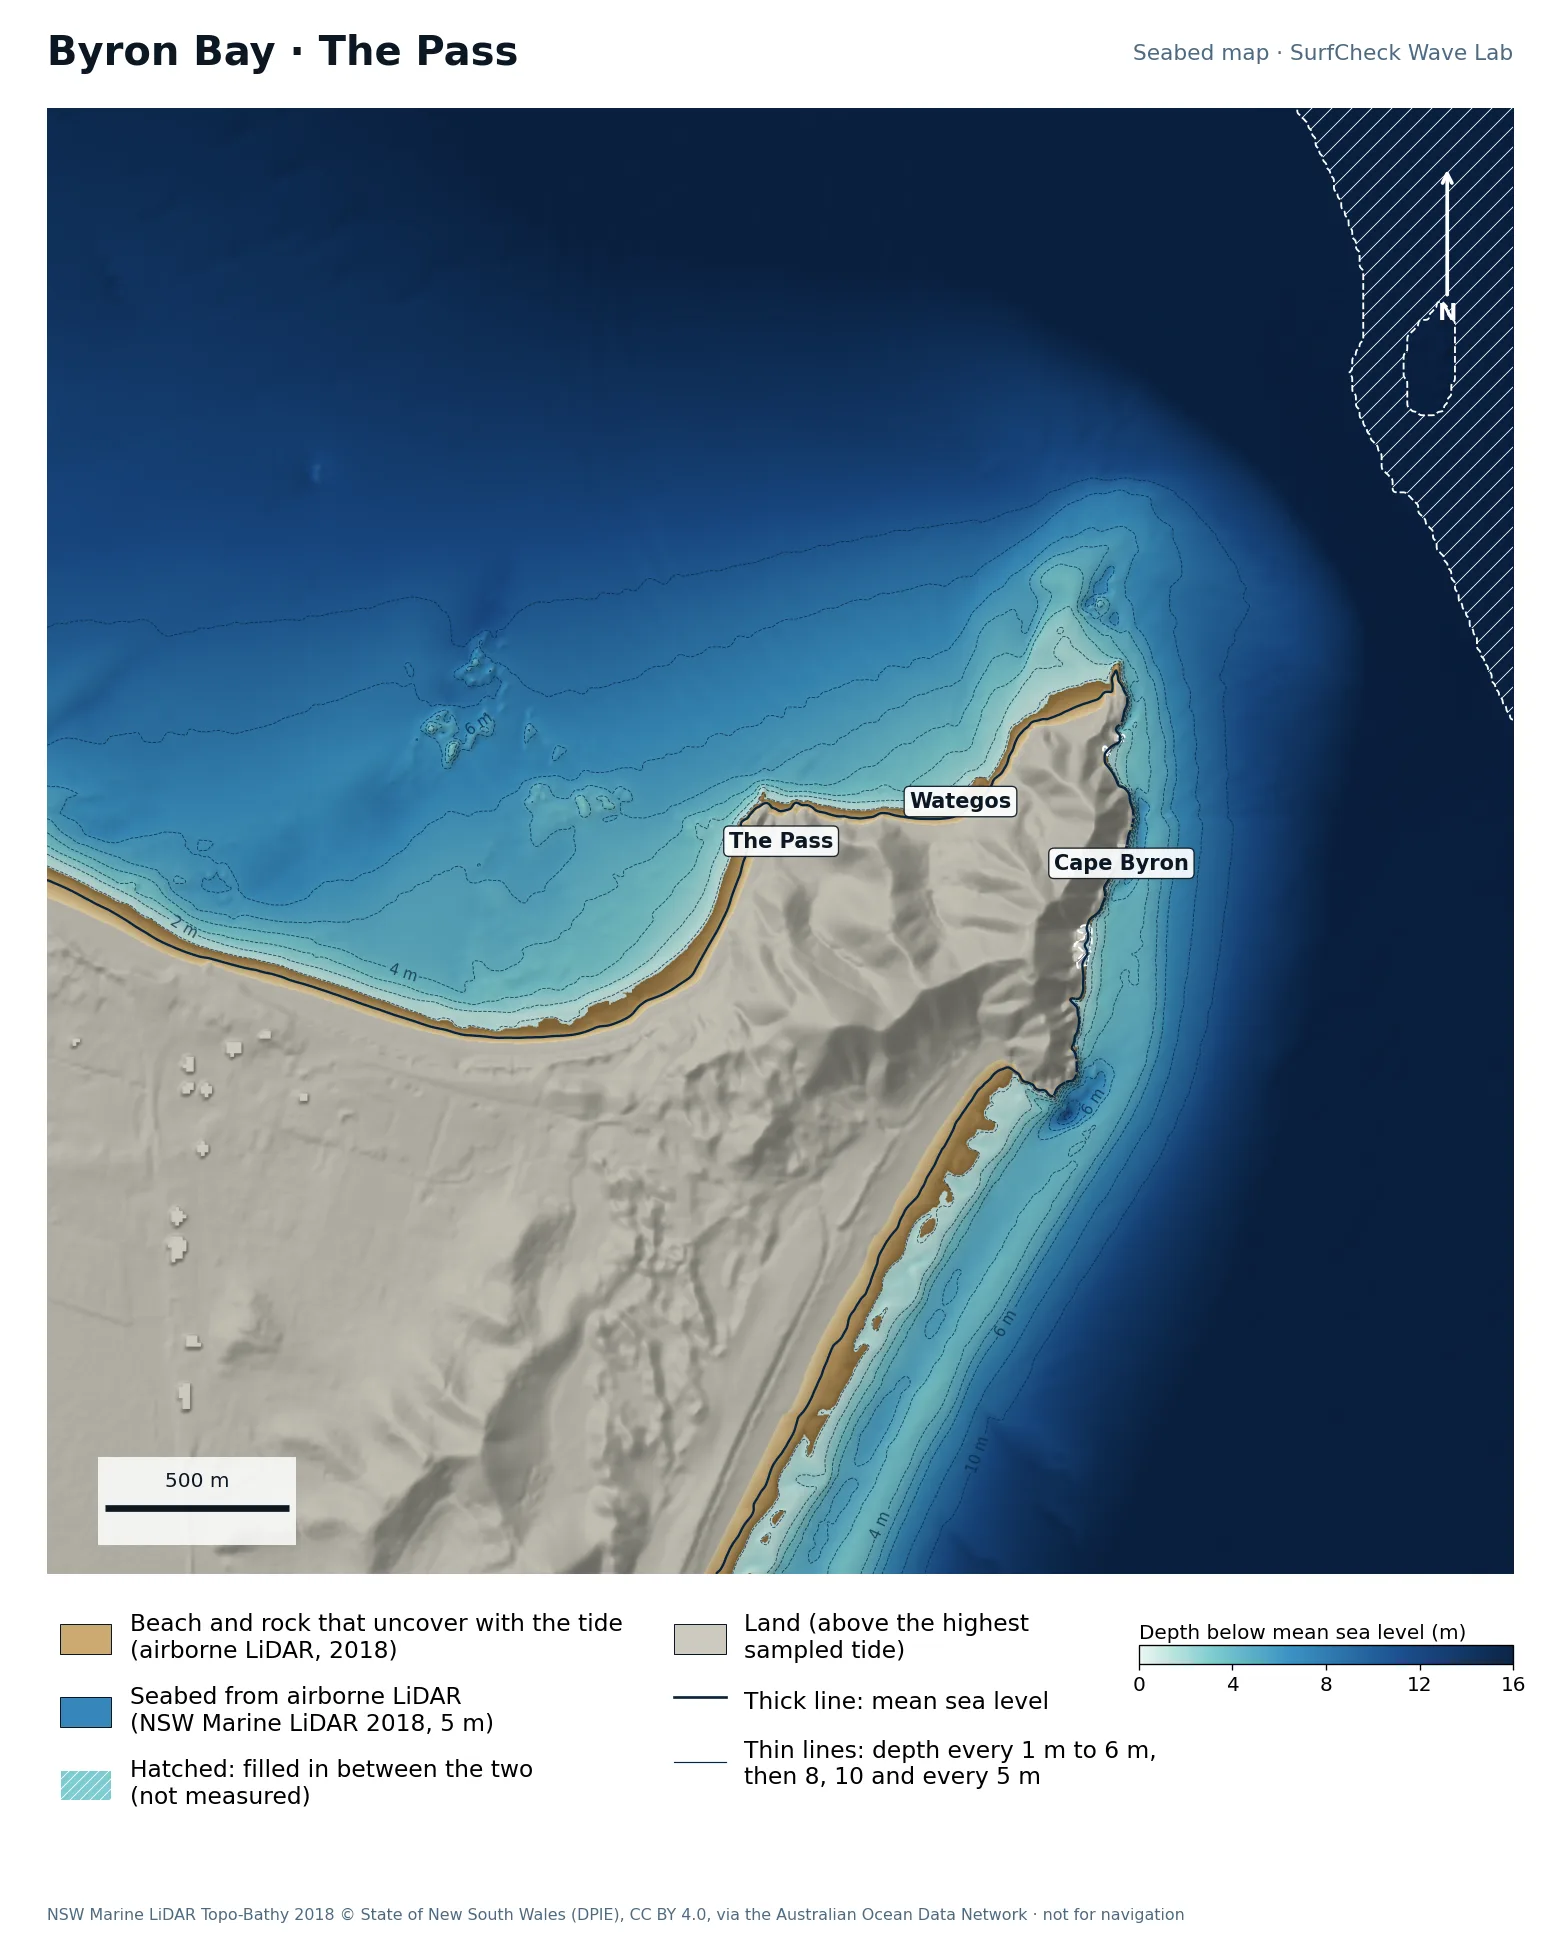
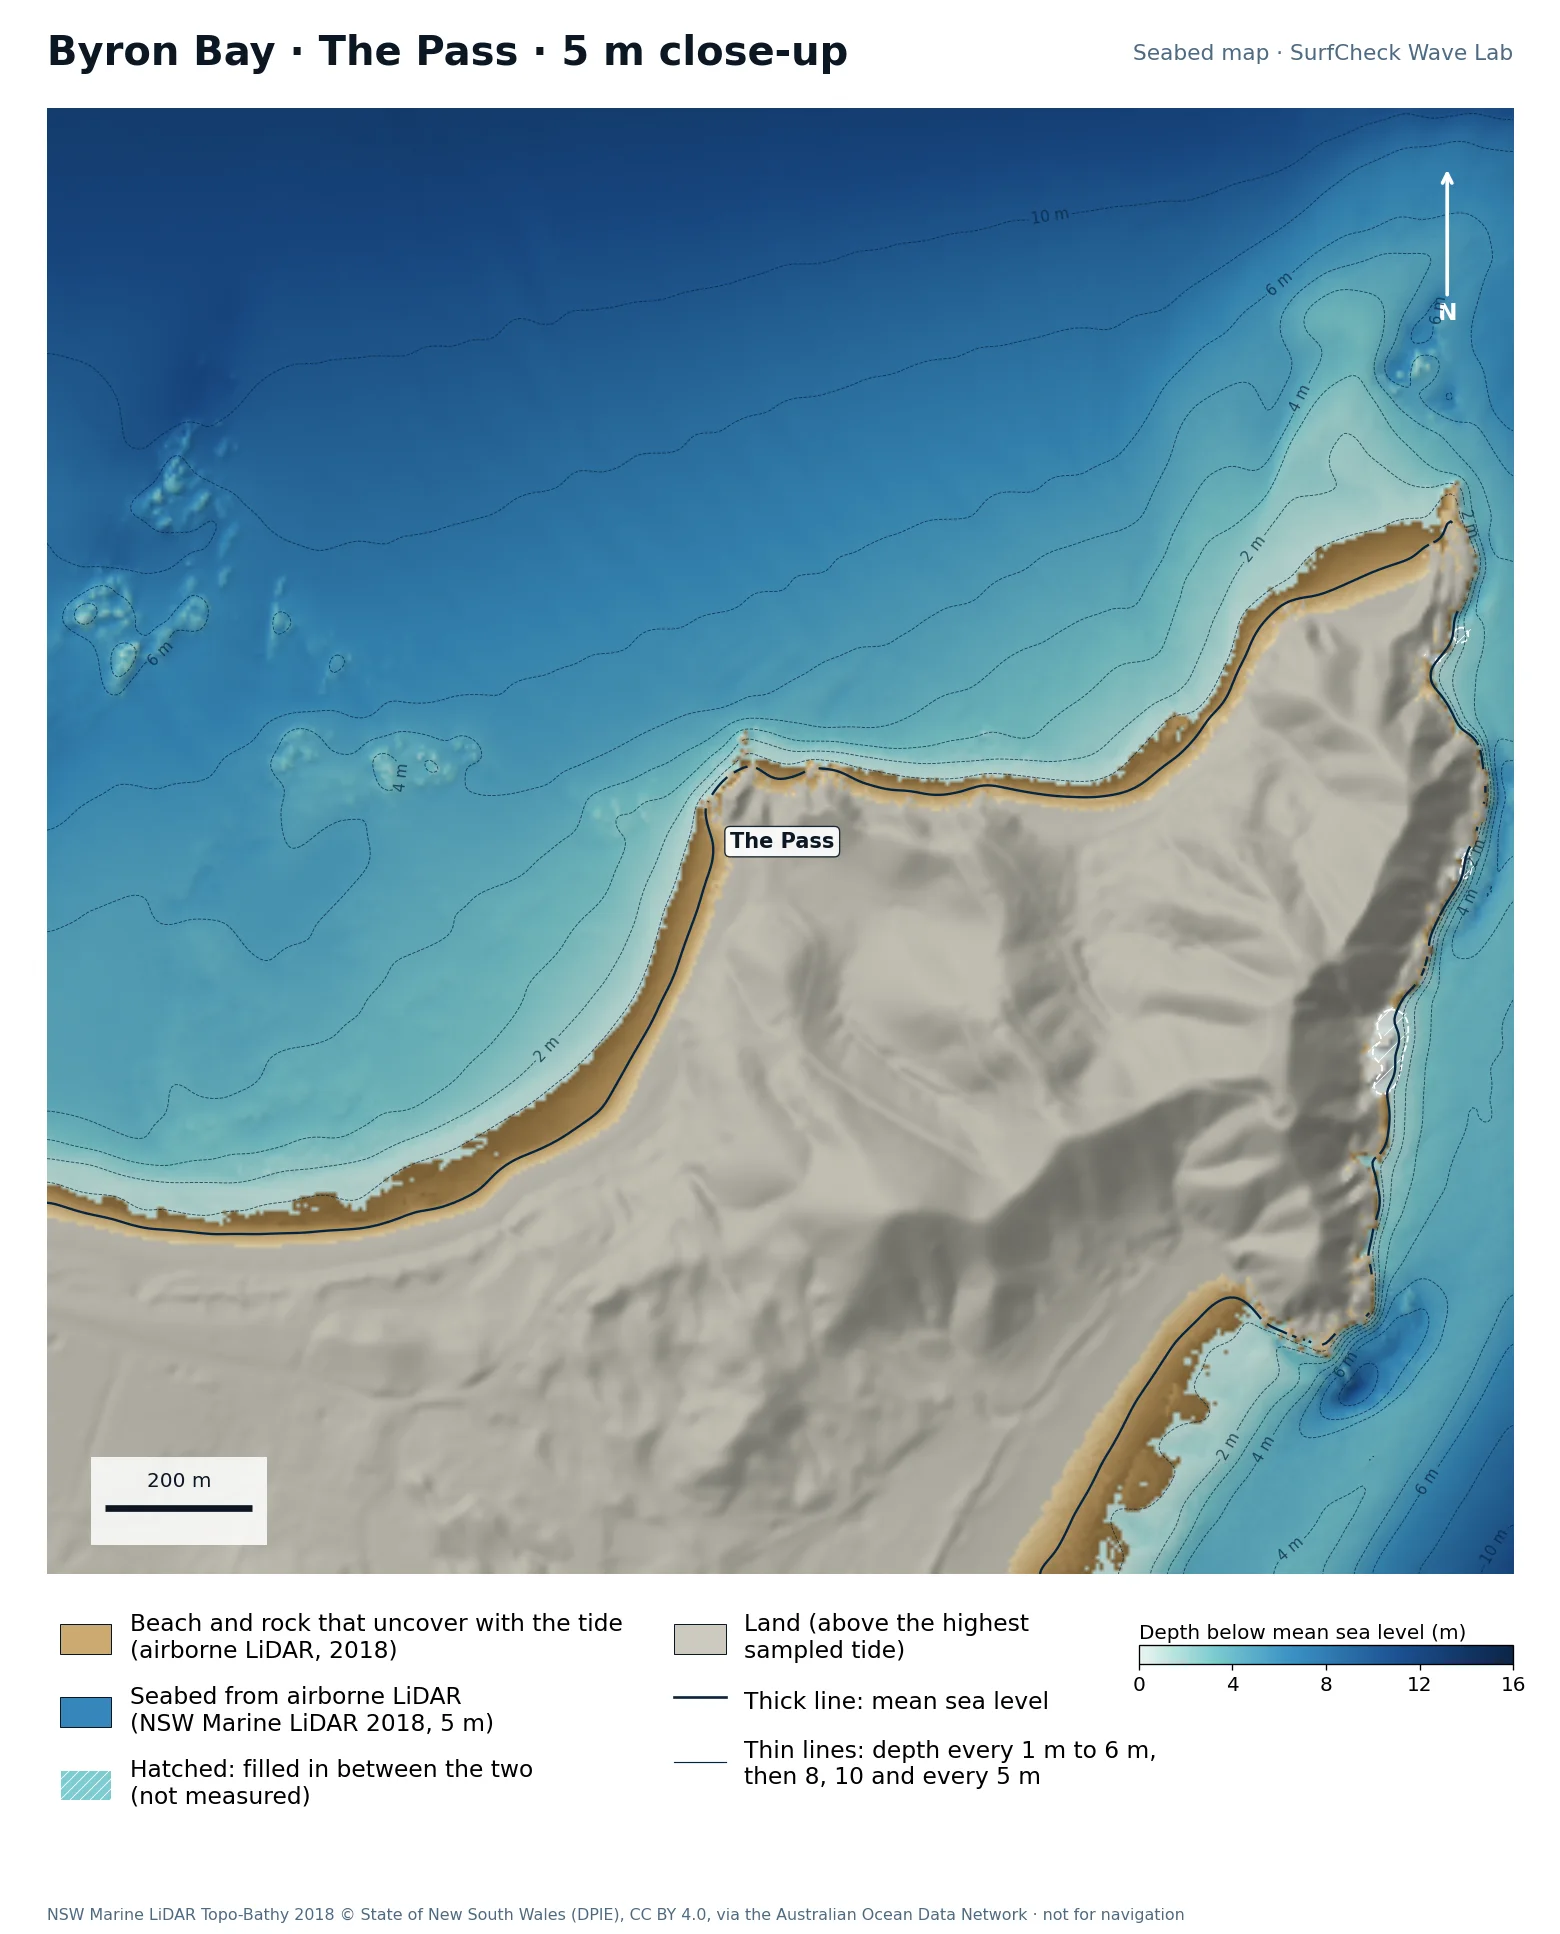
Seabed map of Byron Bay · The Pass: depth contours, the reef or beach that uncovers with the tide, and which parts are measuredClose-up of Byron Bay · The Pass in finer detail from LiDAR
96%
of the sea here is measured
33 ha
uncovers with the tide
5 m
airborne LiDAR, 2018
Offshore
only deep water is filled in

What the seabed shows

Cape Byron, the most easterly point of mainland Australia, with The Pass and Wategos tucked in on its north side and the main beach beyond. Deep water runs close to the Cape on its east side.

How sure we are

96% of the sea in this map is measured. Beach and seabed both come from one airborne LiDAR survey flown in 2018, at 5 m, out to 20 to 40 m depth. Sand has moved since.

In the Wave Lab

Biggest on swell from roughly 10° (+38% against its own average) and smallest from 120° (-54%). Tested for swell from 10° to 130°, with the seabed turned to face each direction. Overlapping tests agree within about 7%.

Run it in the Wave Lab

New South Wales · Headland point

Broken Head

Well measured
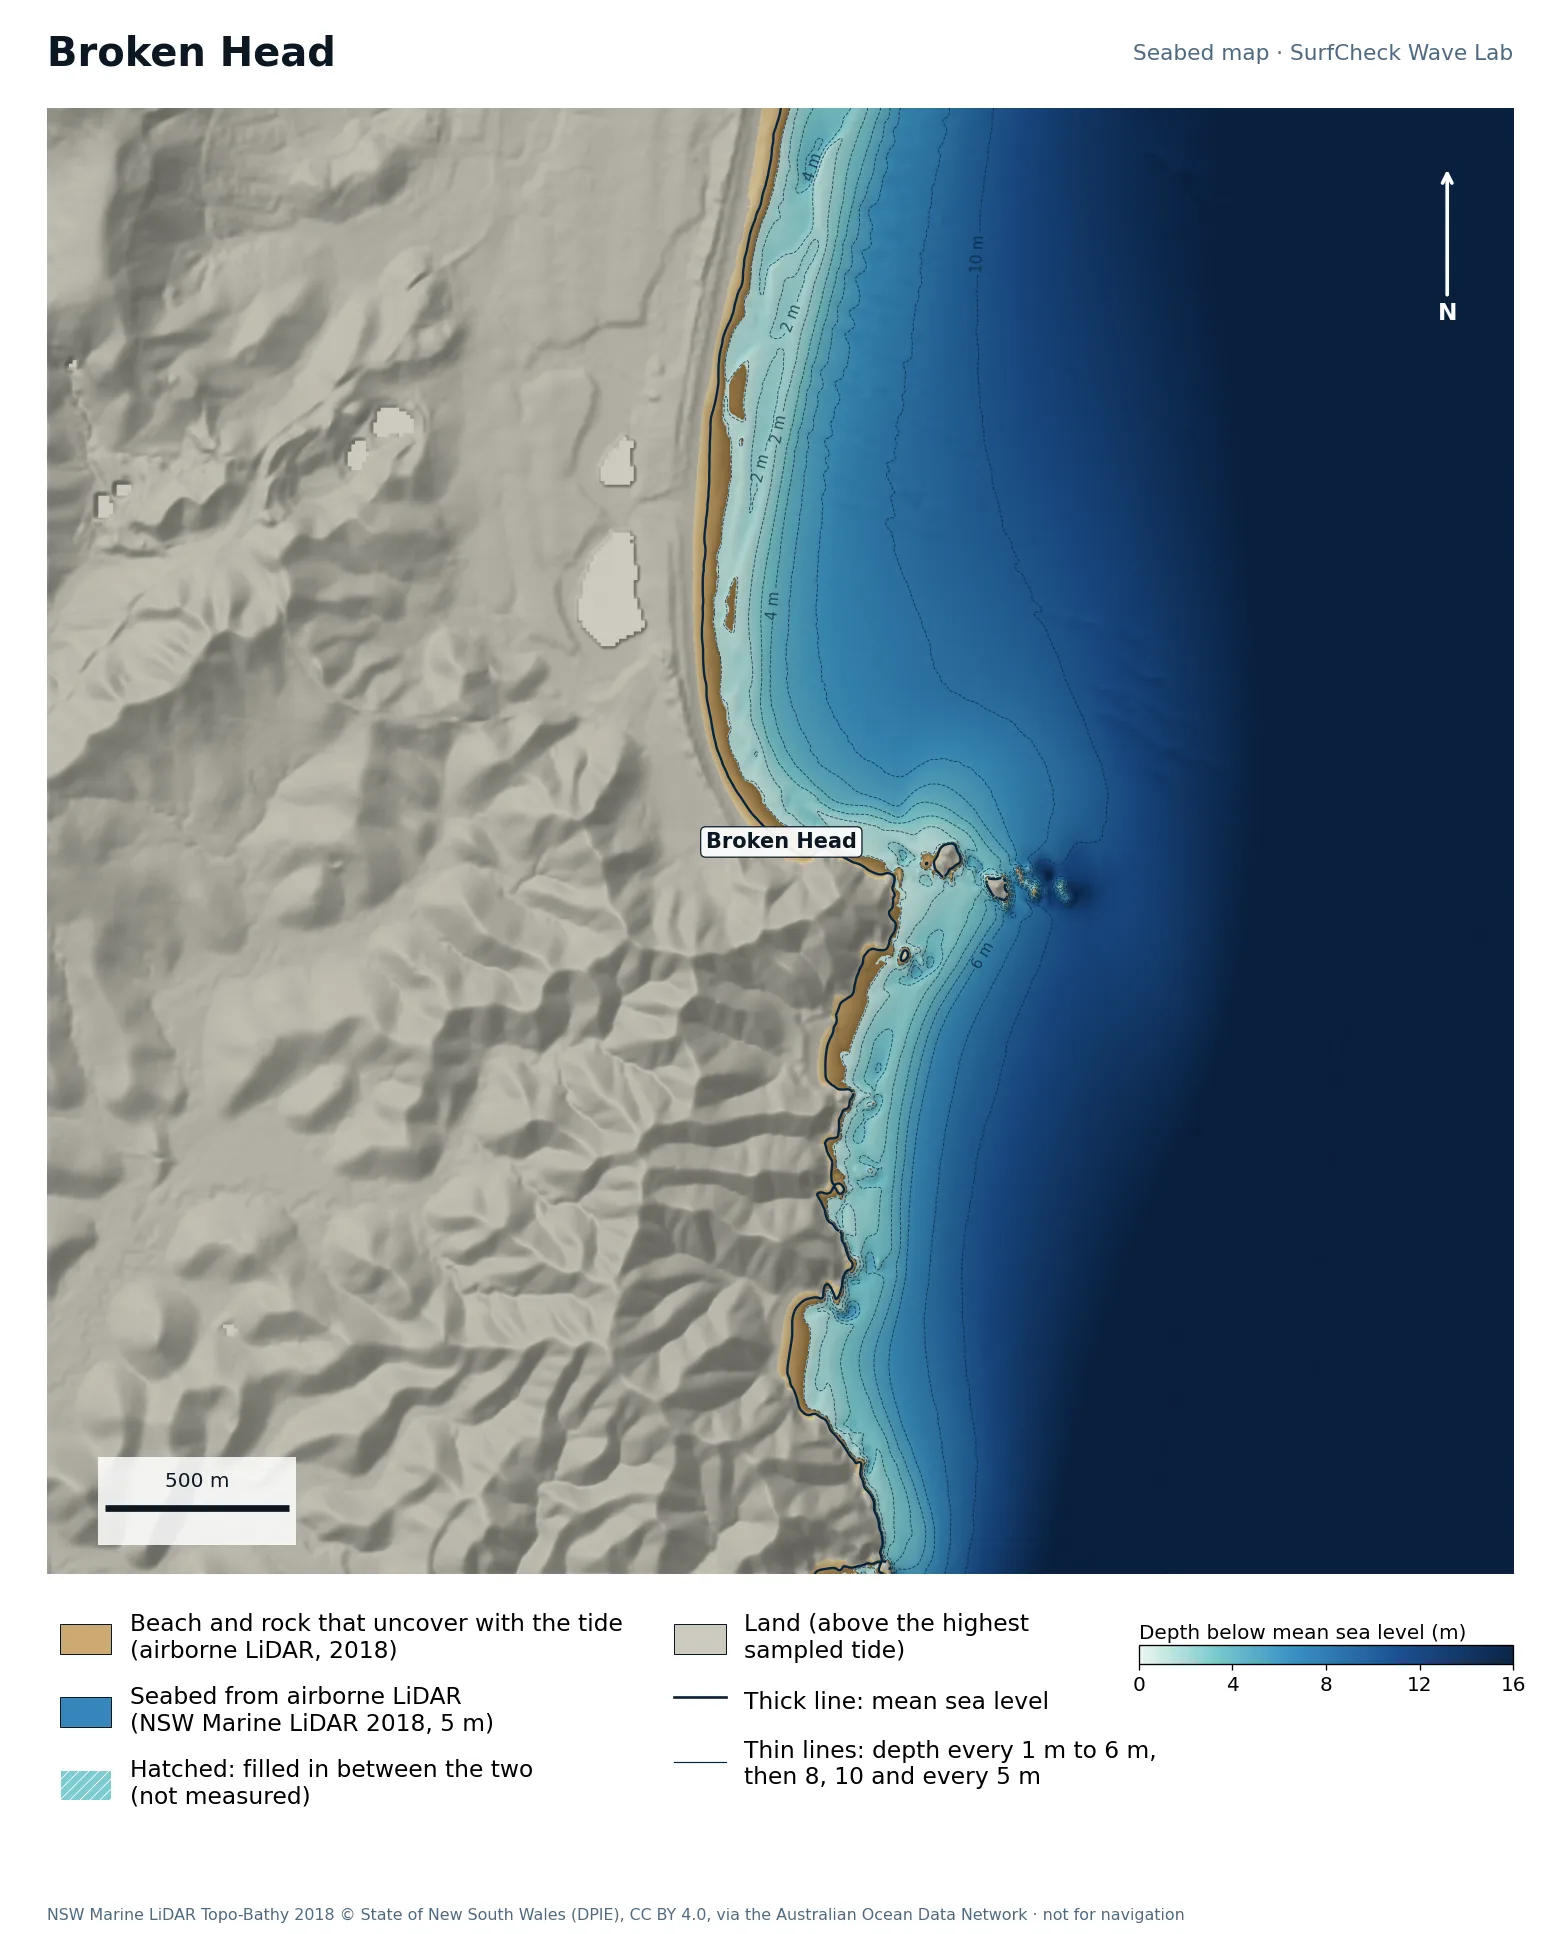
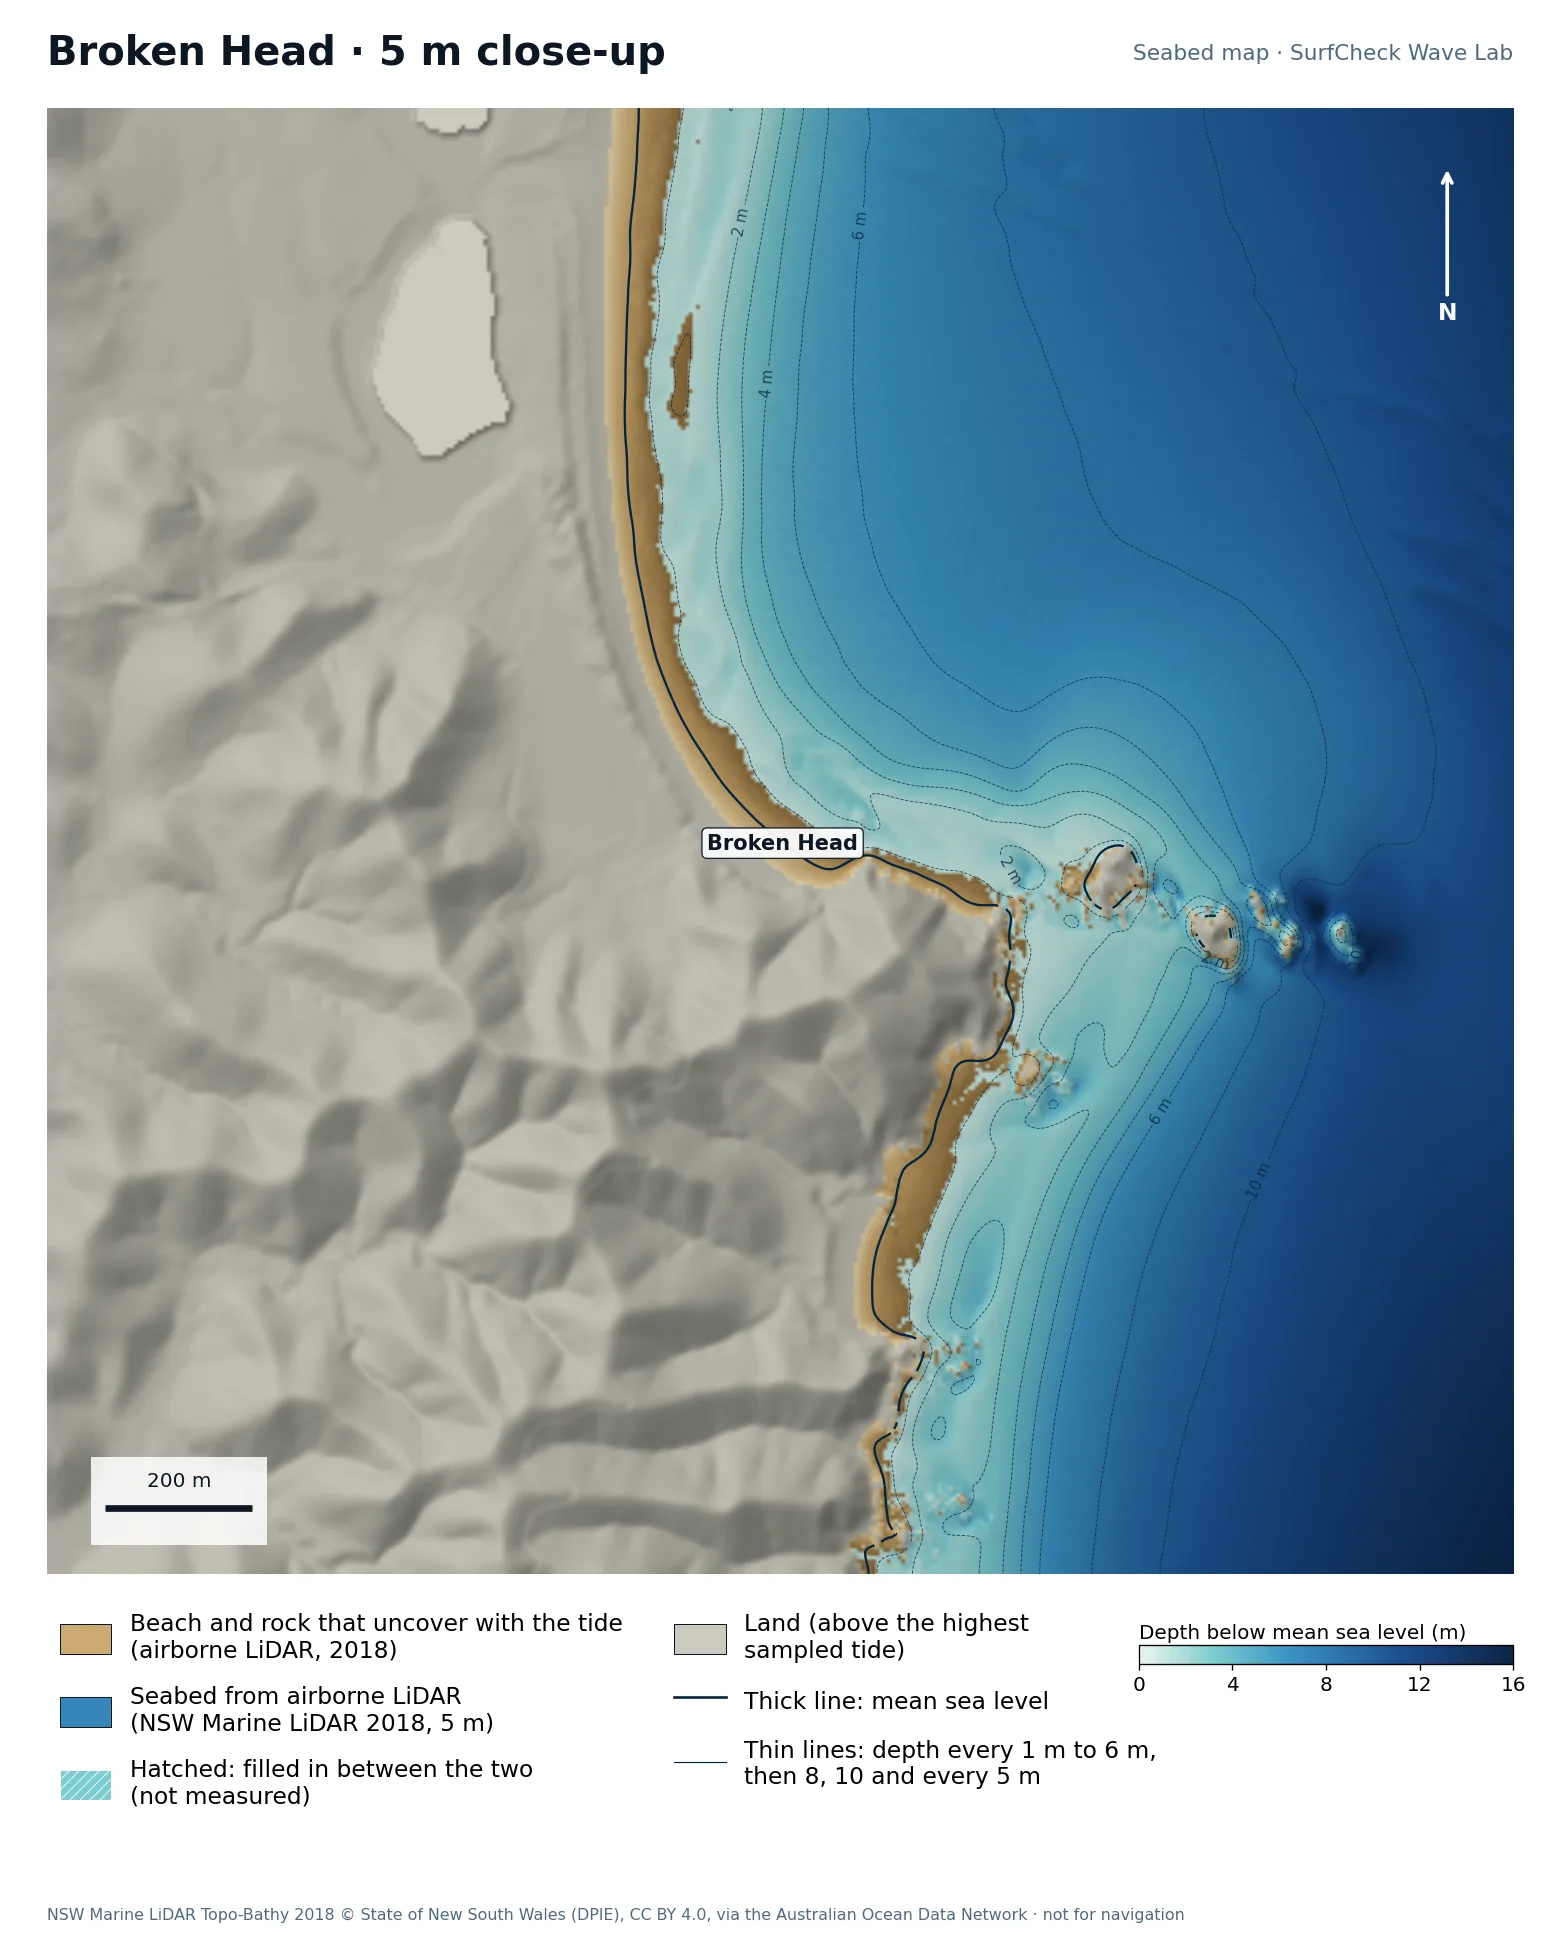
Seabed map of Broken Head: depth contours, the reef or beach that uncovers with the tide, and which parts are measuredClose-up of Broken Head in finer detail from LiDAR
100%
of the sea here is measured
24 ha
uncovers with the tide
5 m
airborne LiDAR, 2018
None
filled-in band, typical width

What the seabed shows

A rocky head at the south end of Tallow Beach, with sand banks on its north side.

How sure we are

100% of the sea in this map is measured. Beach and seabed both come from one airborne LiDAR survey flown in 2018, at 5 m, out to 20 to 40 m depth. Sand has moved since.

In the Wave Lab

Biggest on swell from roughly 50° (+19% against its own average) and smallest from 140° (-75%). Tested for swell from 20° to 140°, with the seabed turned to face each direction. Overlapping tests agree within about 10%.

Run it in the Wave Lab

New South Wales · Boulder point

Lennox Head

Well measured
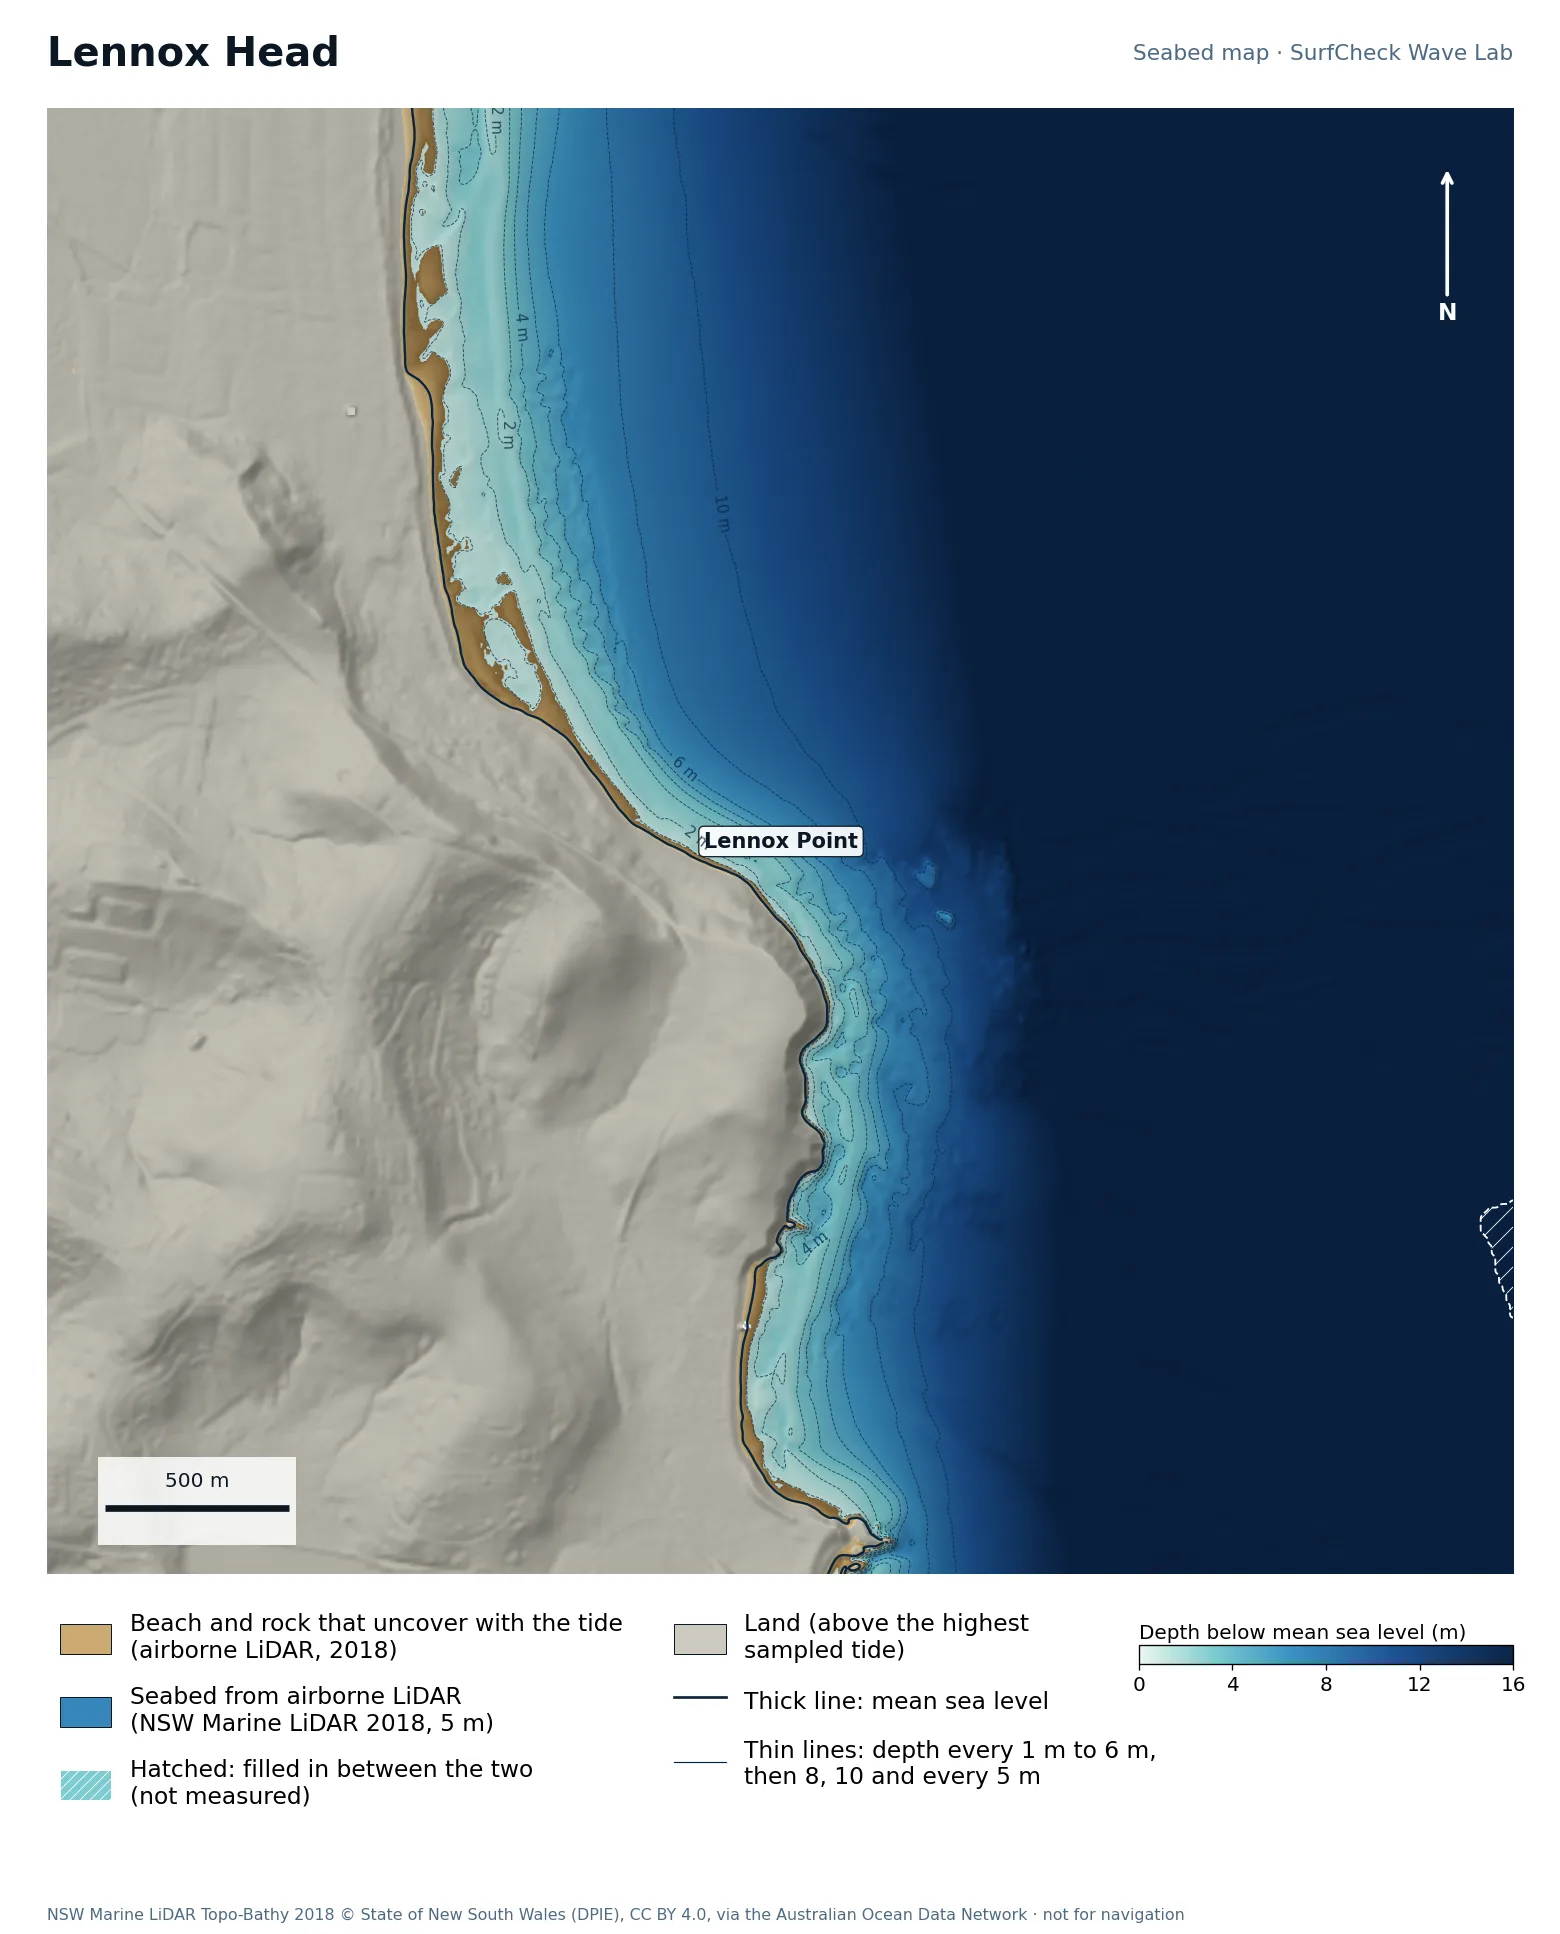
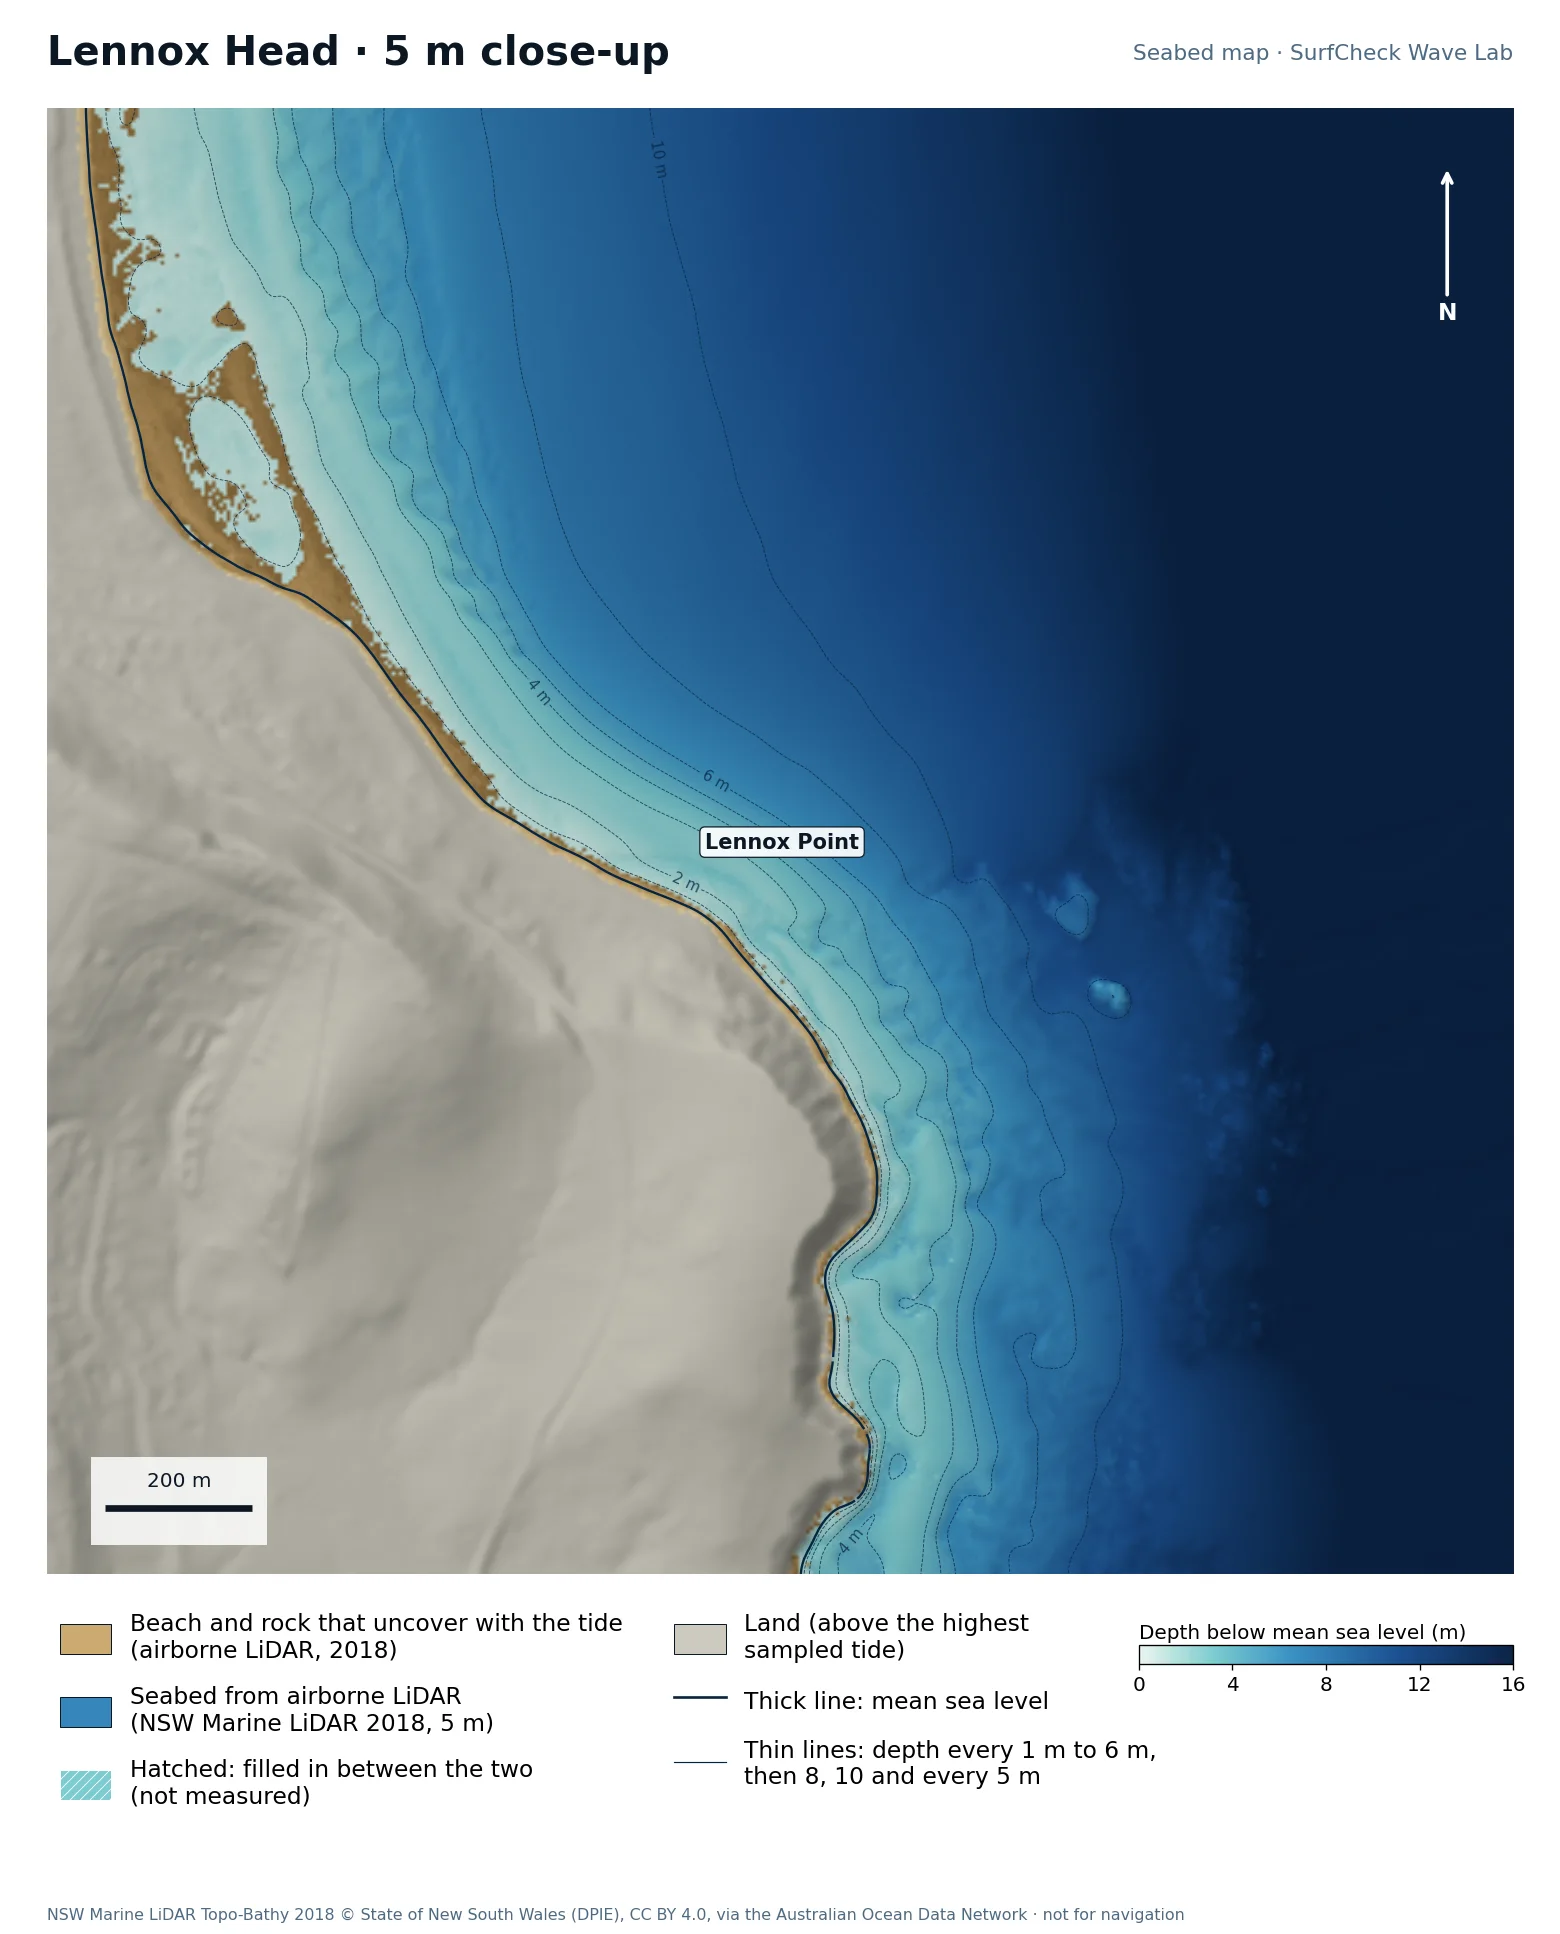
Seabed map of Lennox Head: depth contours, the reef or beach that uncovers with the tide, and which parts are measuredClose-up of Lennox Head in finer detail from LiDAR
100%
of the sea here is measured
20 ha
uncovers with the tide
5 m
airborne LiDAR, 2018
None
filled-in band, typical width

What the seabed shows

A headland with rock and boulder reef along its foot, and Seven Mile Beach running north from it. The reef ledges show as fine texture along the point.

How sure we are

100% of the sea in this map is measured. Beach and seabed both come from one airborne LiDAR survey flown in 2018, at 5 m, out to 20 to 40 m depth. Sand has moved since.

In the Wave Lab

Not fussy about direction: a spread of 18% across the range, which is too close to call. Tested for swell from 20° to 140°, with the seabed turned to face each direction.

Run it in the Wave Lab

Sydney, New South Wales · River-mouth bank

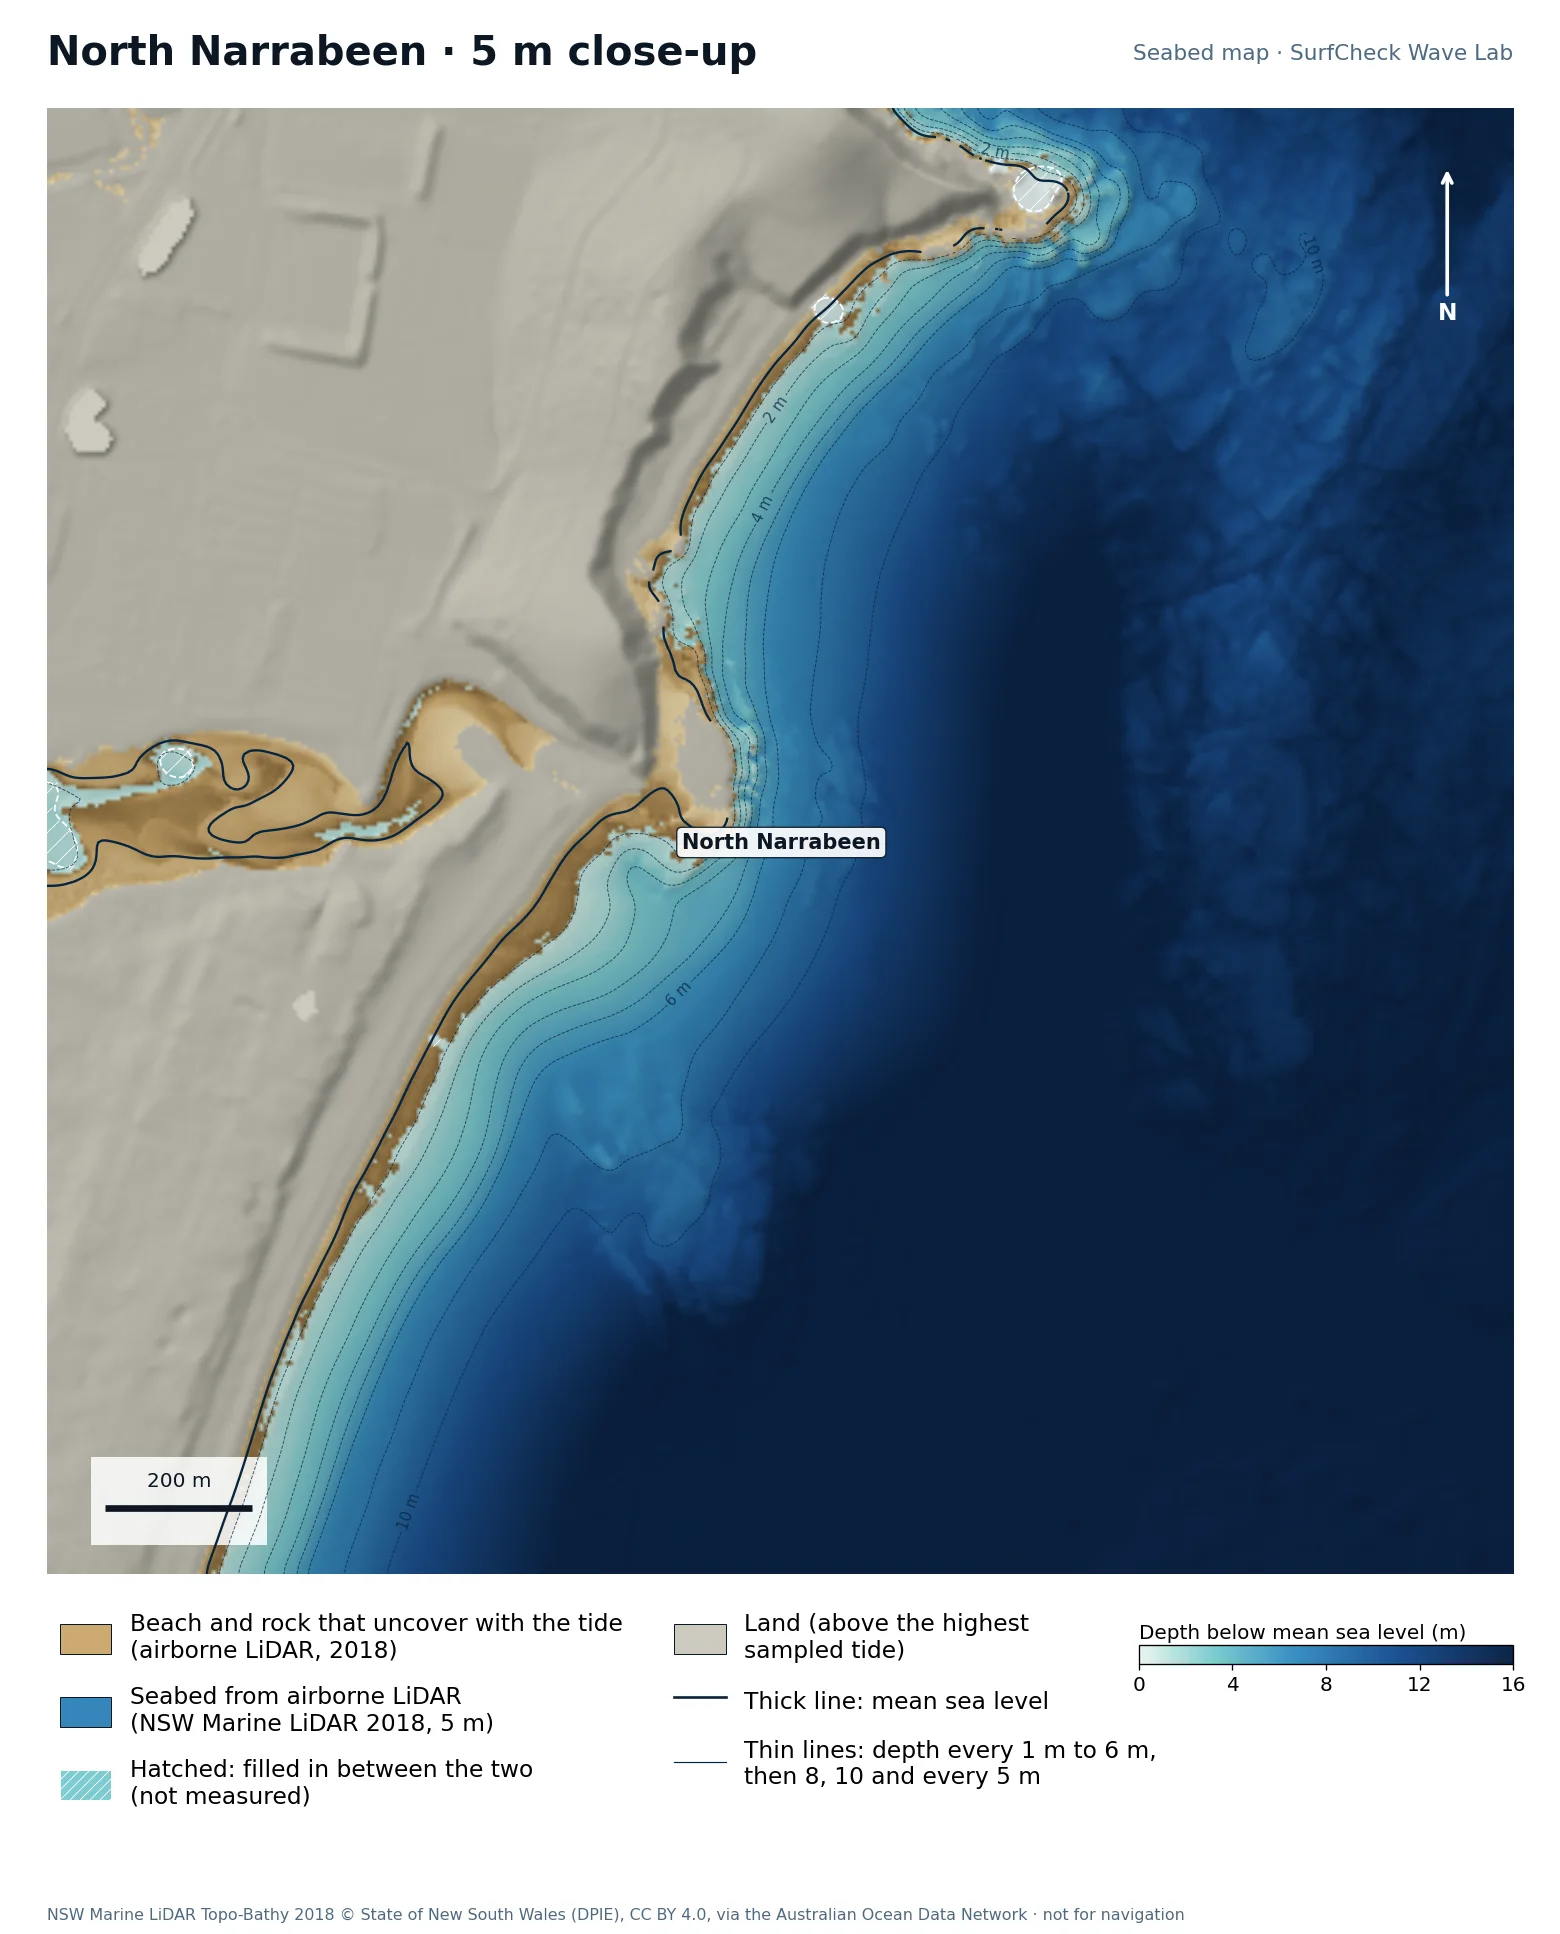
North Narrabeen

Well measured
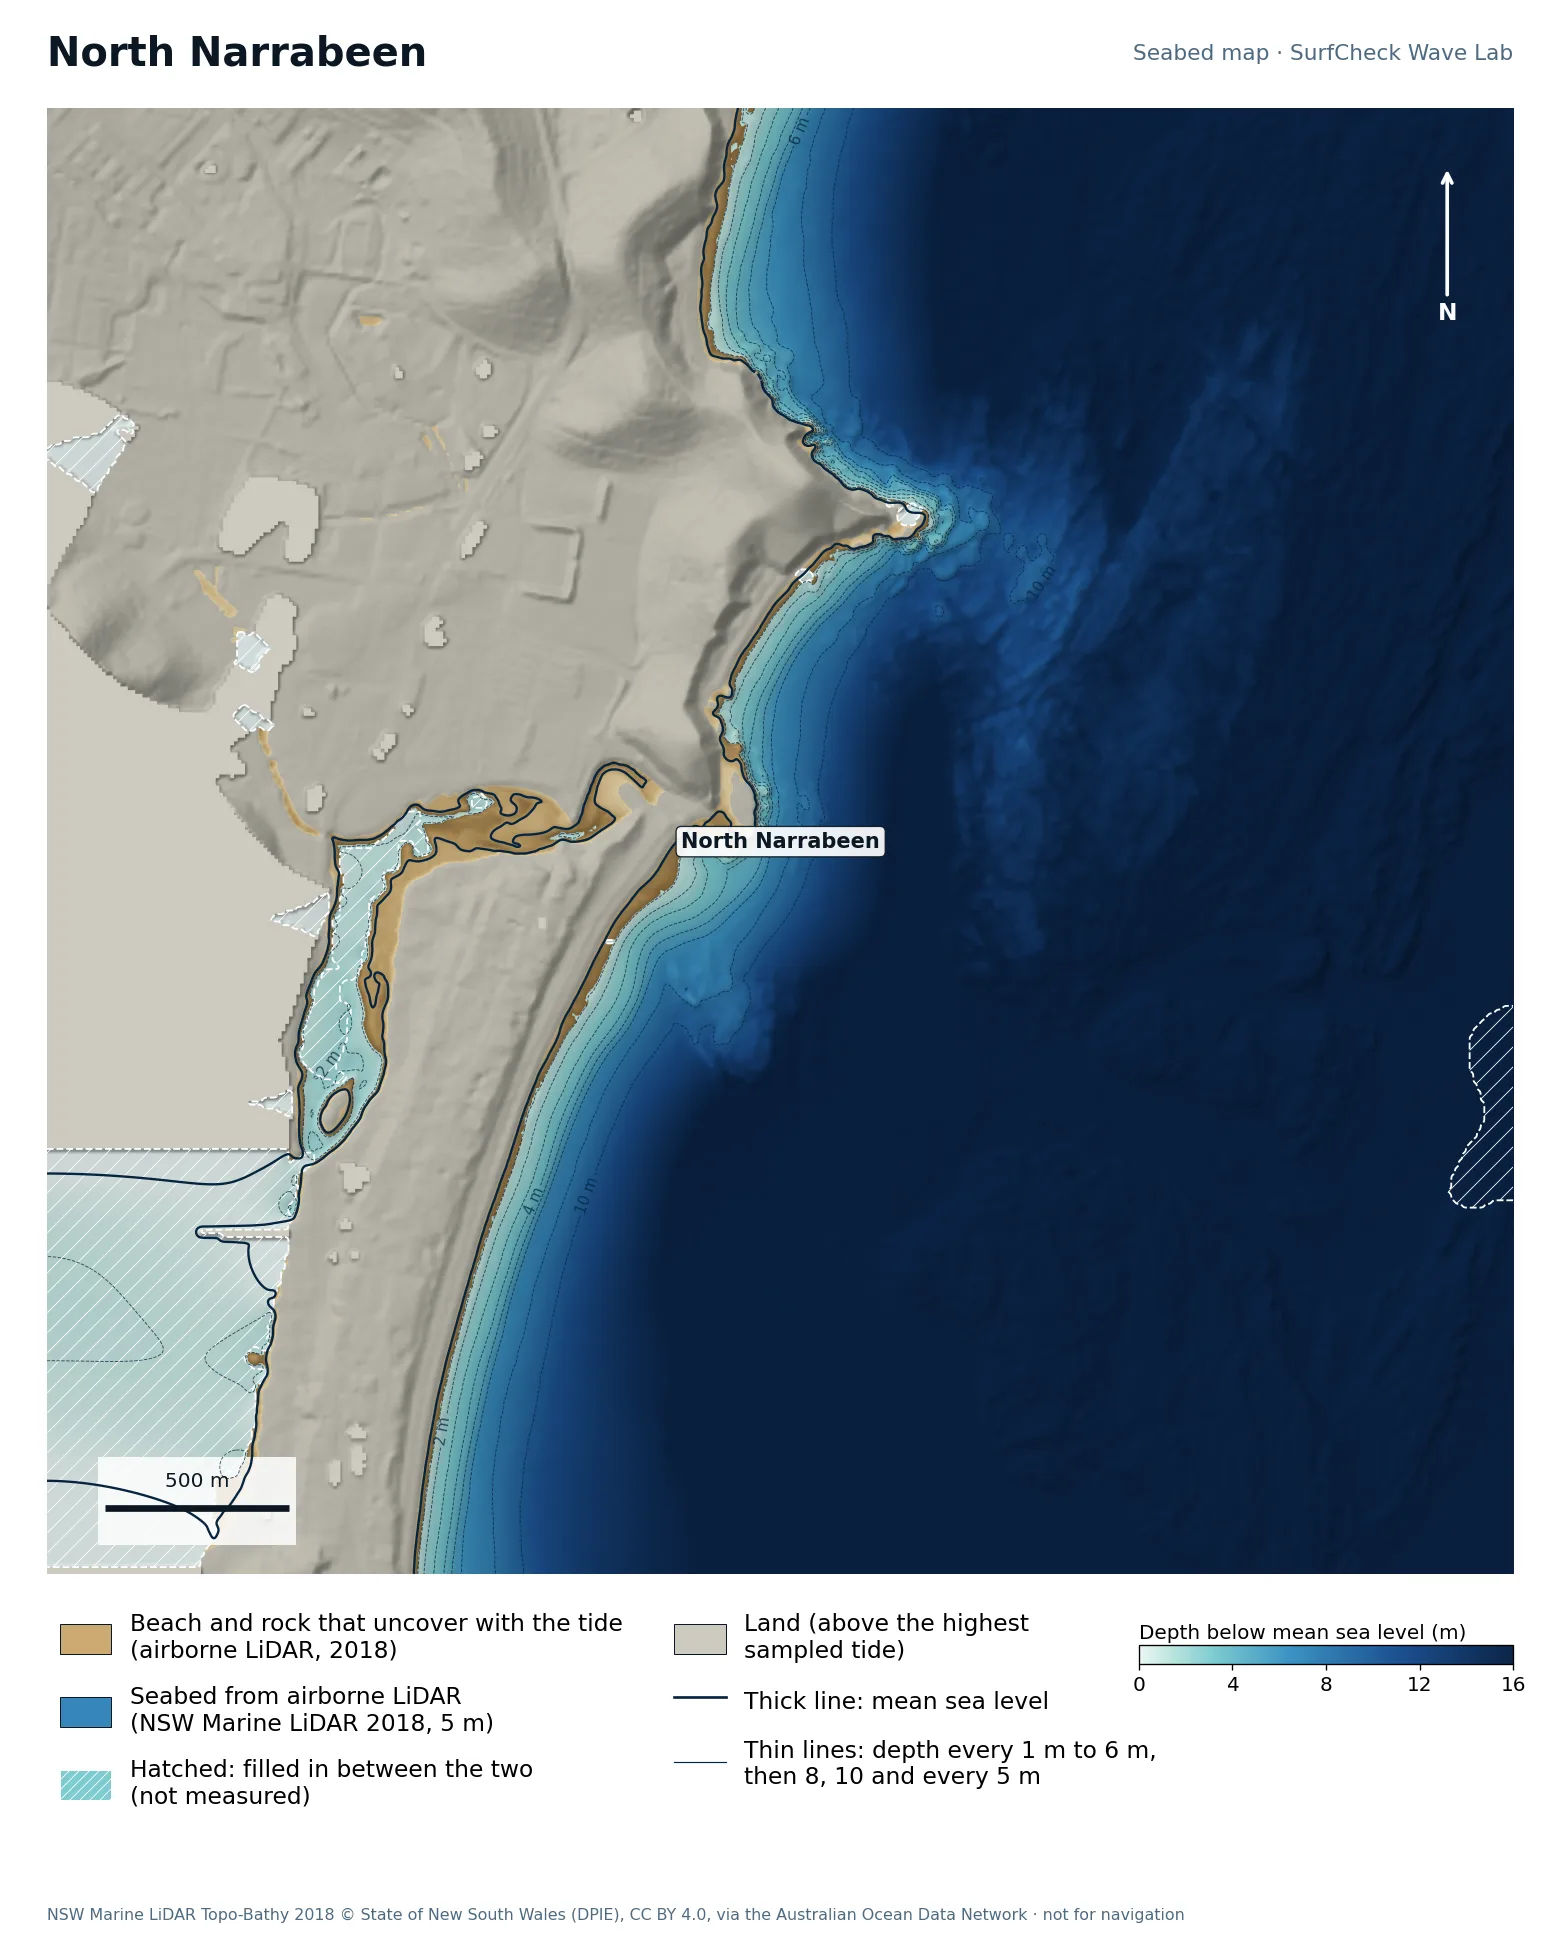
Seabed map of North Narrabeen: depth contours, the reef or beach that uncovers with the tide, and which parts are measuredClose-up of North Narrabeen in finer detail from LiDAR
92%
of the sea here is measured
34 ha
uncovers with the tide
5 m
airborne LiDAR, 2018
Offshore
only deep water is filled in

What the seabed shows

The lagoon entrance at the north end of Narrabeen beach, with the head and its rock platform beside it.

How sure we are

92% of the sea in this map is measured. Beach and seabed both come from one airborne LiDAR survey flown in 2018, at 5 m, out to 20 to 40 m depth. Sand has moved since.

In the Wave Lab

Swell direction is too close to call: the model cannot separate directions that differ by less than about 30% in breaker size. Tide changes breaker size by under 4%.

Run it in the Wave Lab

Sydney, New South Wales · Rock ledge point

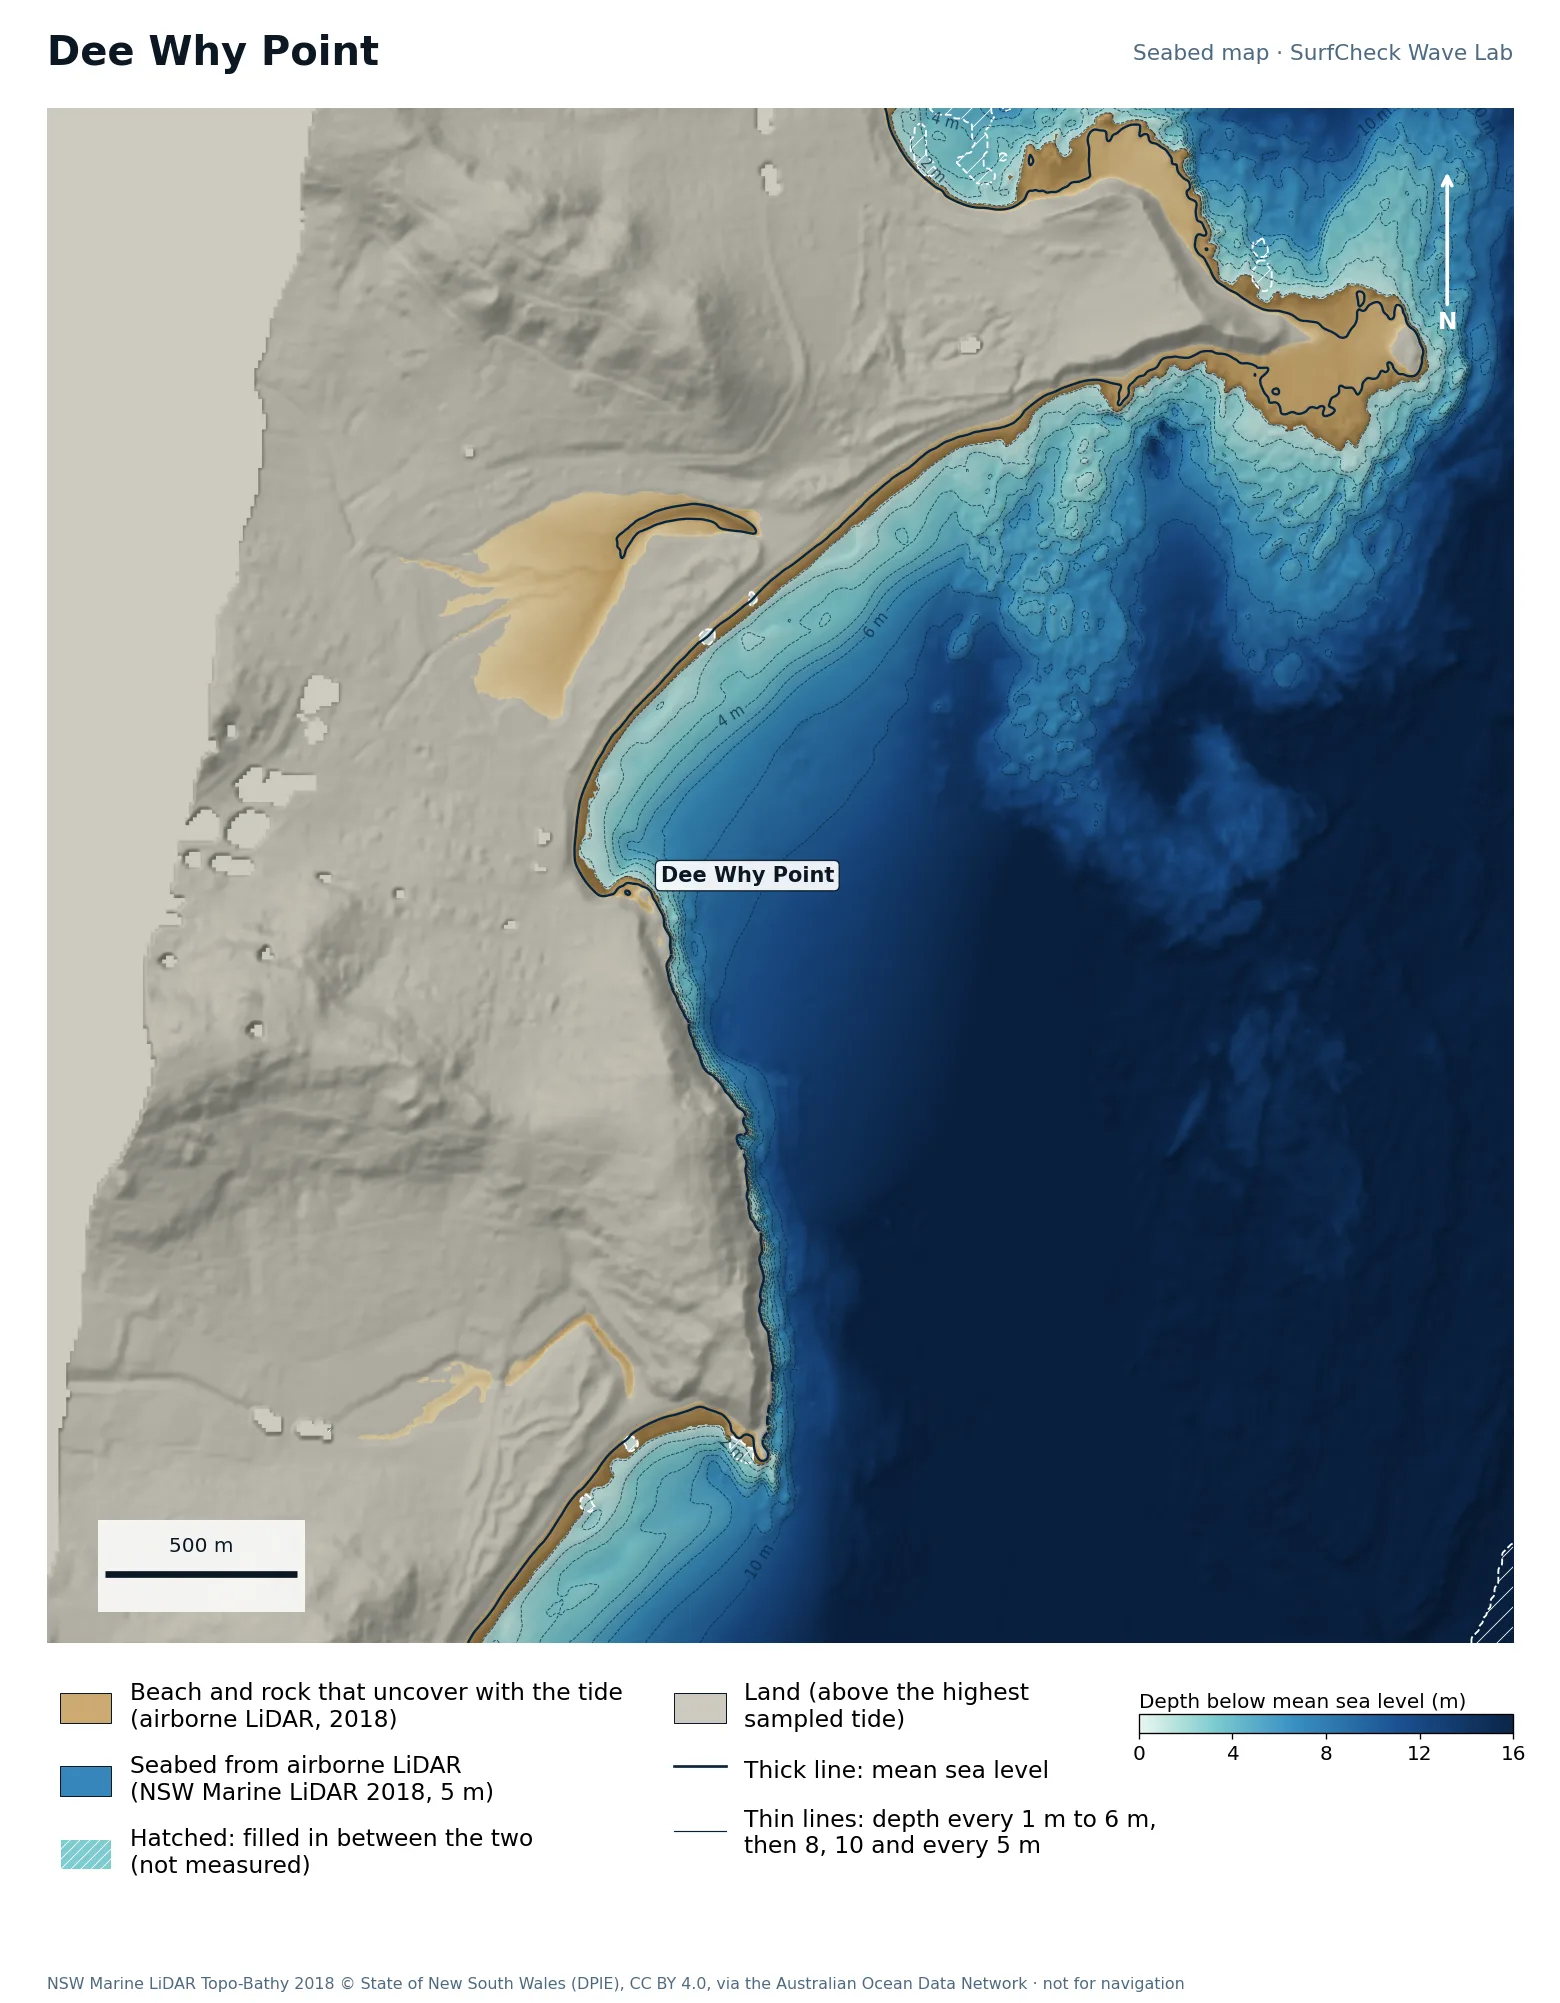
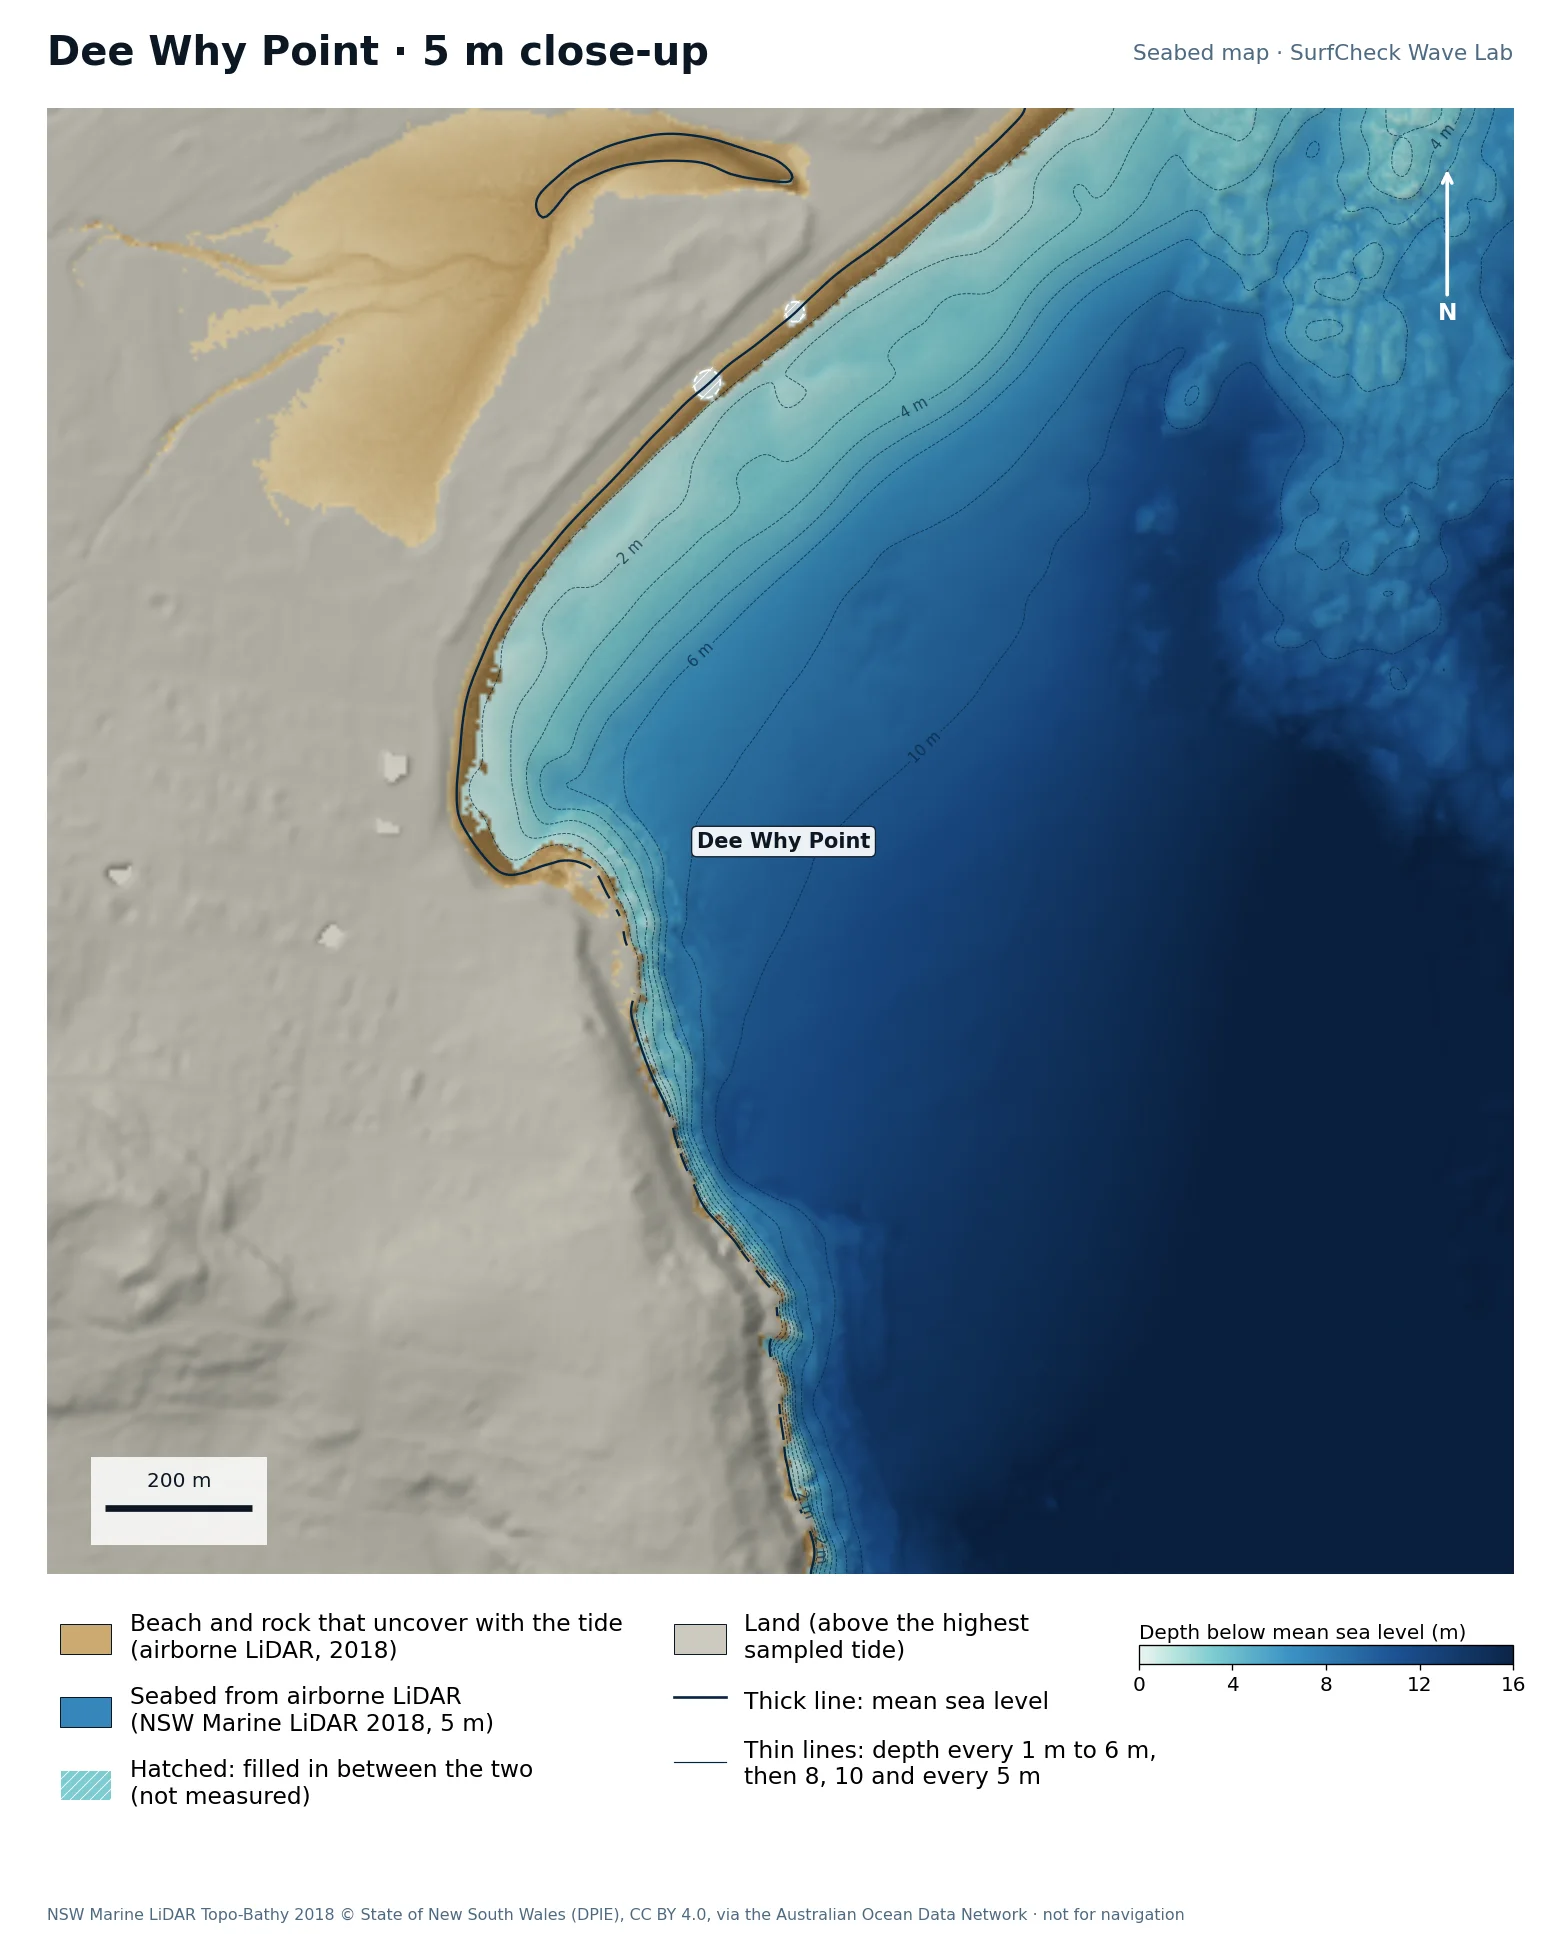
Dee Why Point

Well measured
Seabed map of Dee Why Point: depth contours, the reef or beach that uncovers with the tide, and which parts are measuredClose-up of Dee Why Point in finer detail from LiDAR
99%
of the sea here is measured
62 ha
uncovers with the tide
5 m
airborne LiDAR, 2018
None
filled-in band, typical width

What the seabed shows

A rock shelf at the south end of Dee Why beach with deep water close outside it.

How sure we are

99% of the sea in this map is measured. Beach and seabed both come from one airborne LiDAR survey flown in 2018, at 5 m, out to 20 to 40 m depth. Sand has moved since.

In the Wave Lab

Biggest on swell from roughly 120° (+15% against its own average) and smallest from 150° (-25%). Tested for swell from 70° to 150°, with the seabed turned to face each direction. Overlapping tests agree within about 5%.

Run it in the Wave Lab

Sydney, New South Wales · City beach and reef

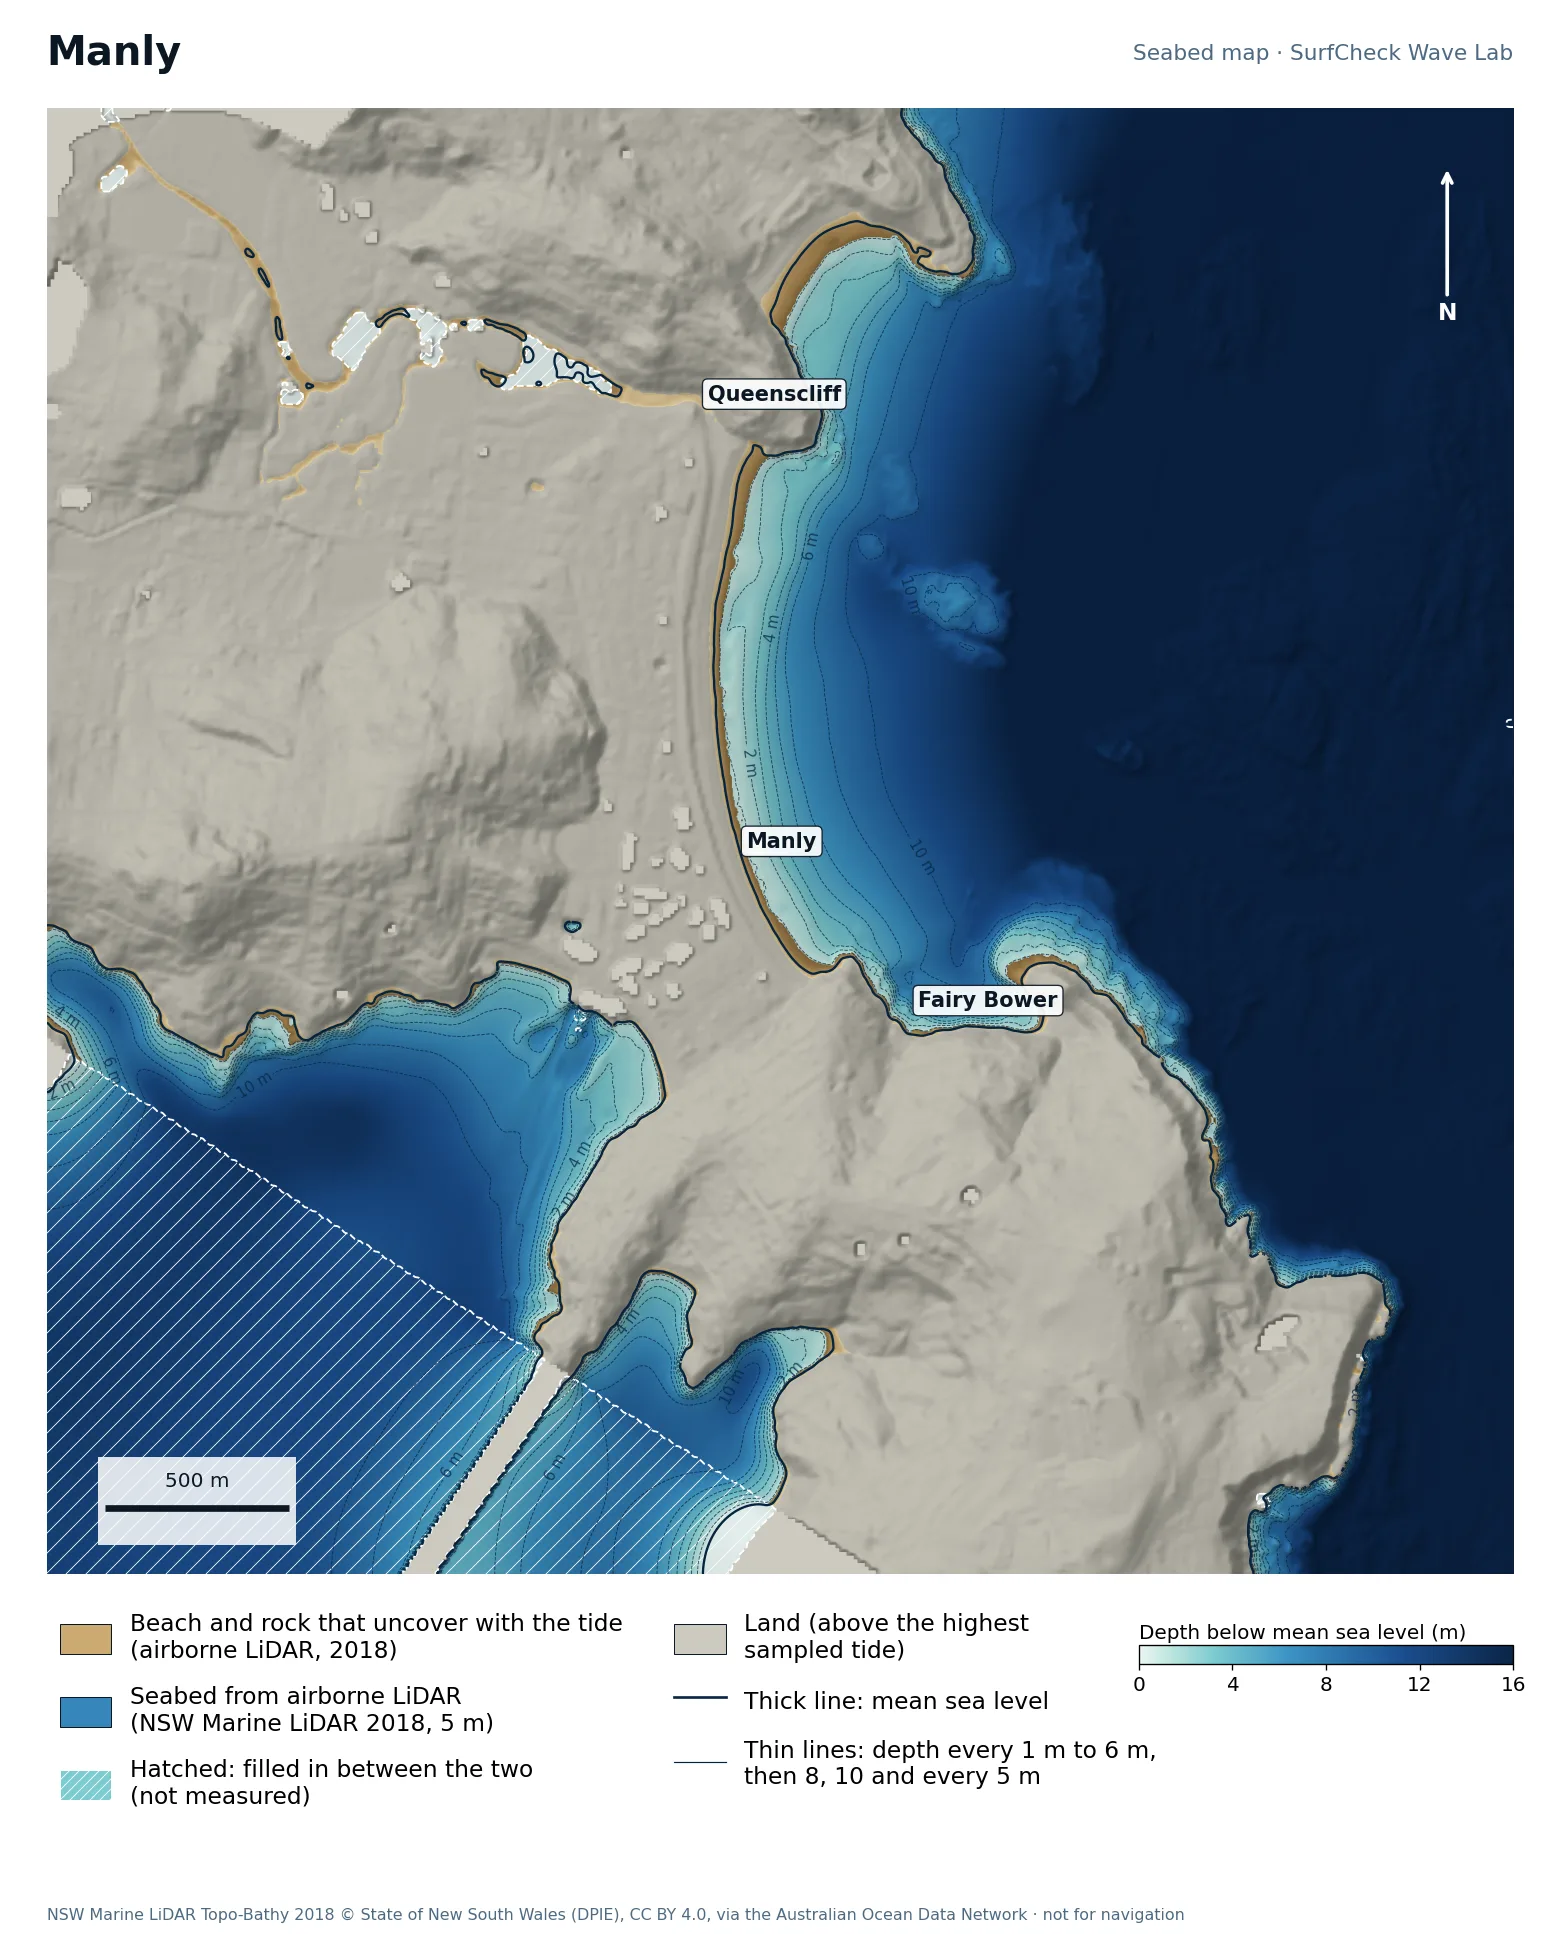
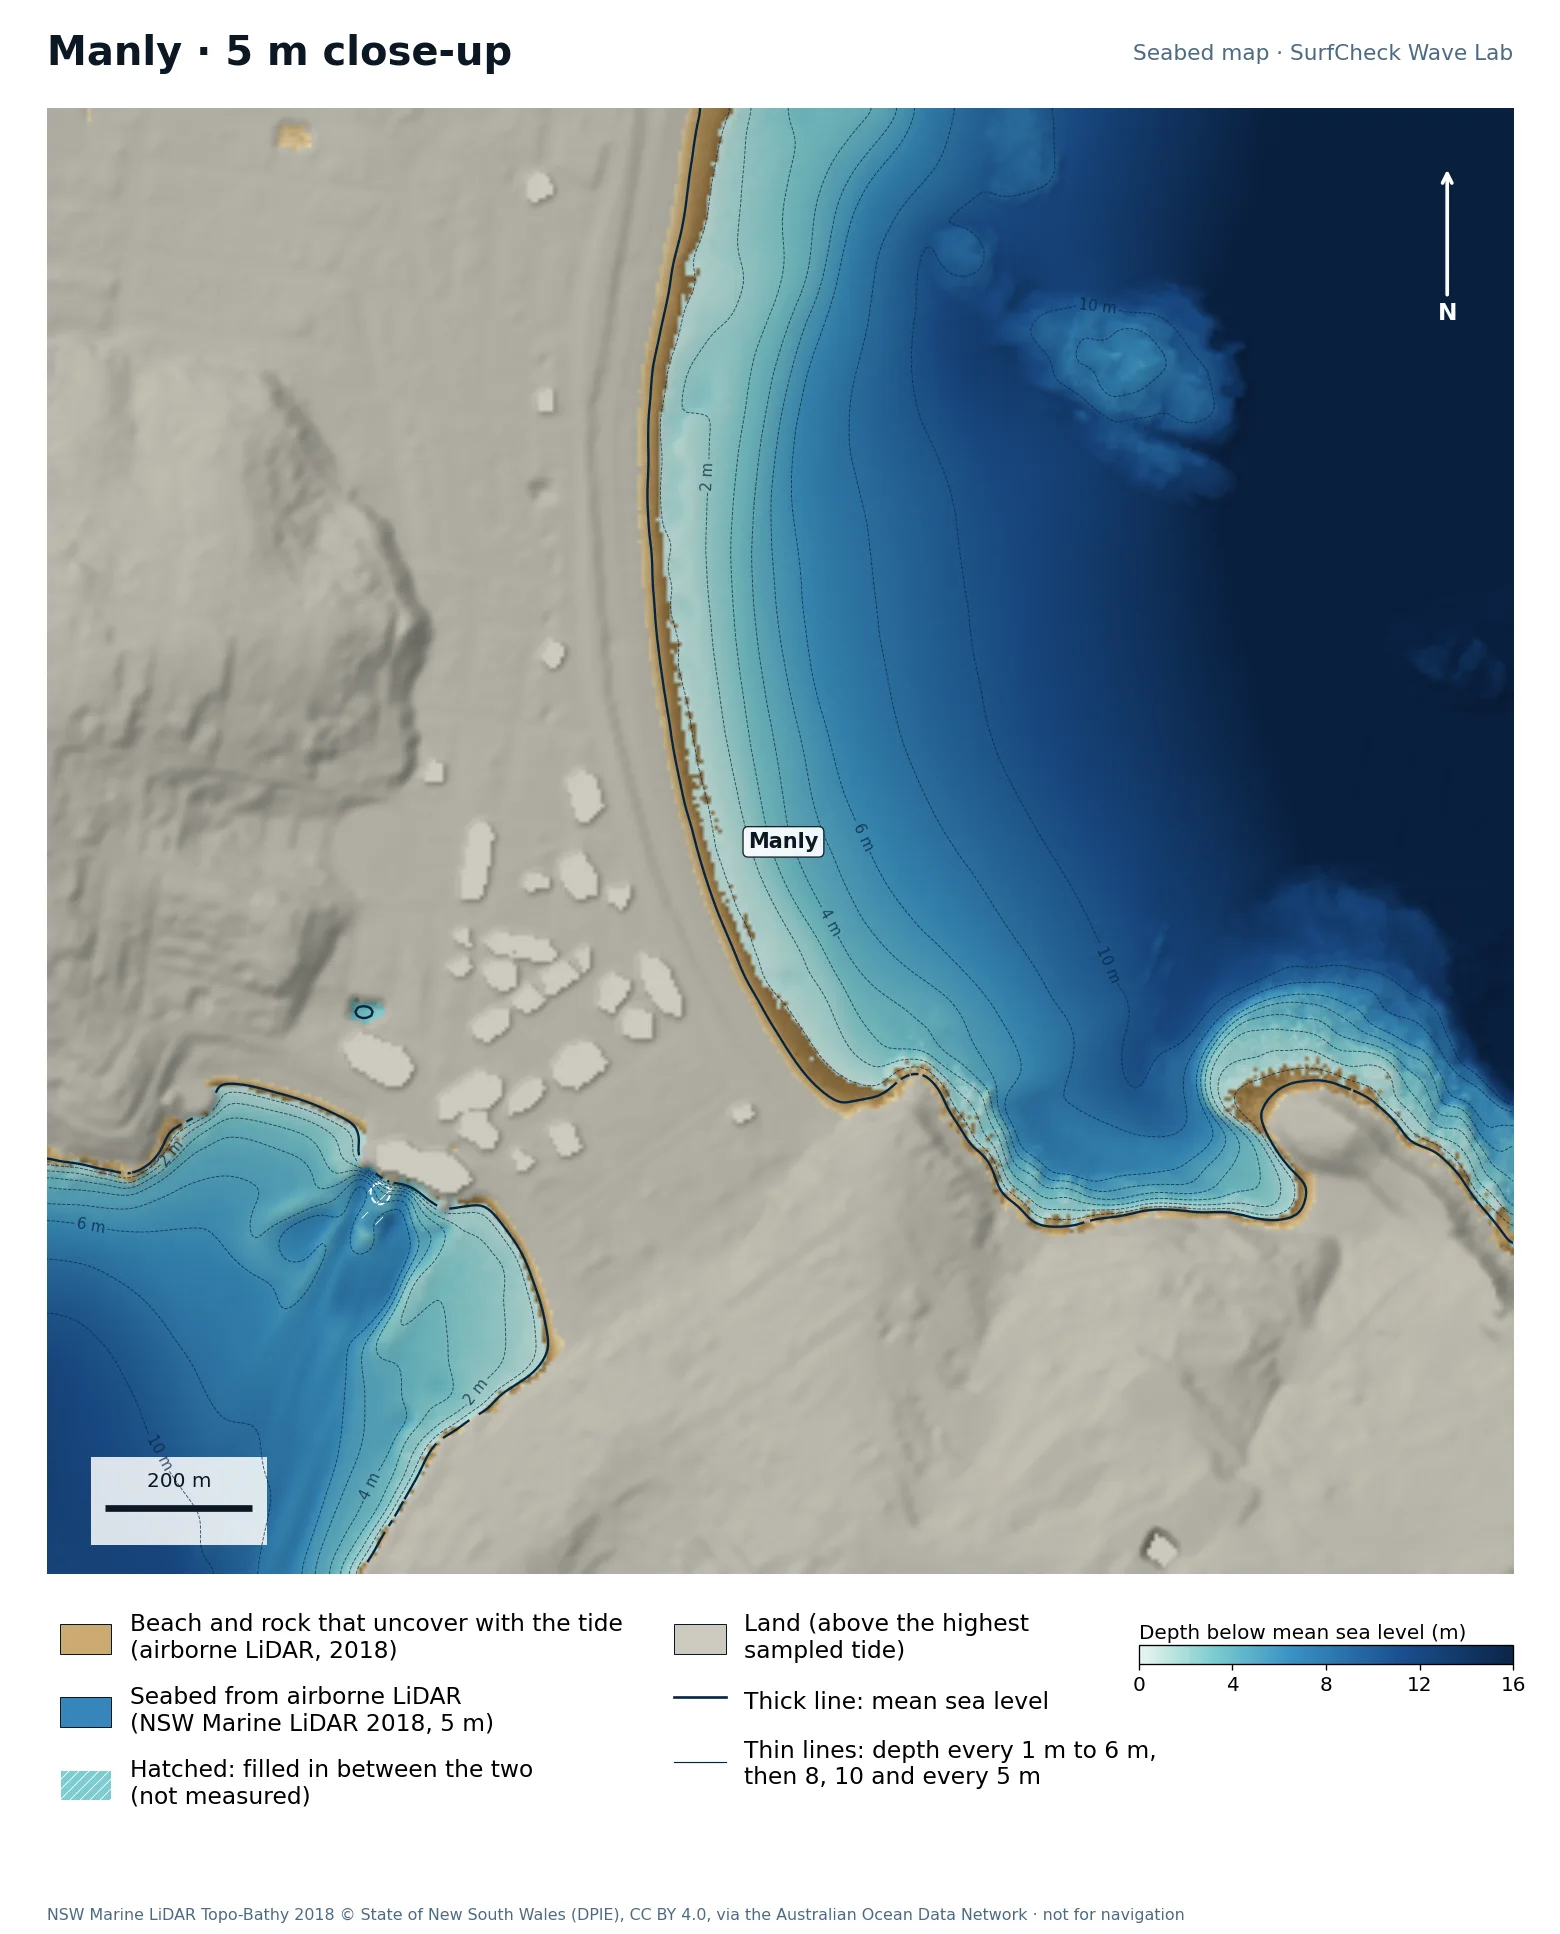
Manly

Well measured
Seabed map of Manly: depth contours, the reef or beach that uncovers with the tide, and which parts are measuredClose-up of Manly in finer detail from LiDAR
82%
of the sea here is measured
29 ha
uncovers with the tide
5 m
airborne LiDAR, 2018
Offshore
only deep water is filled in

What the seabed shows

The beach from Queenscliff to South Steyne, then Fairy Bower and the reefs towards North Head. Sydney Harbour’s entrance is at the bottom of the map.

How sure we are

82% of the sea in this map is measured. Beach and seabed both come from one airborne LiDAR survey flown in 2018, at 5 m, out to 20 to 40 m depth. Sand has moved since. The unmeasured part is deep water inside the harbour entrance.

In the Wave Lab

Swell direction is too close to call: the model cannot separate directions that differ by less than about 30% in breaker size. Tide changes breaker size by under 4%.

Run it in the Wave Lab

Sydney, New South Wales · City beach in a bay

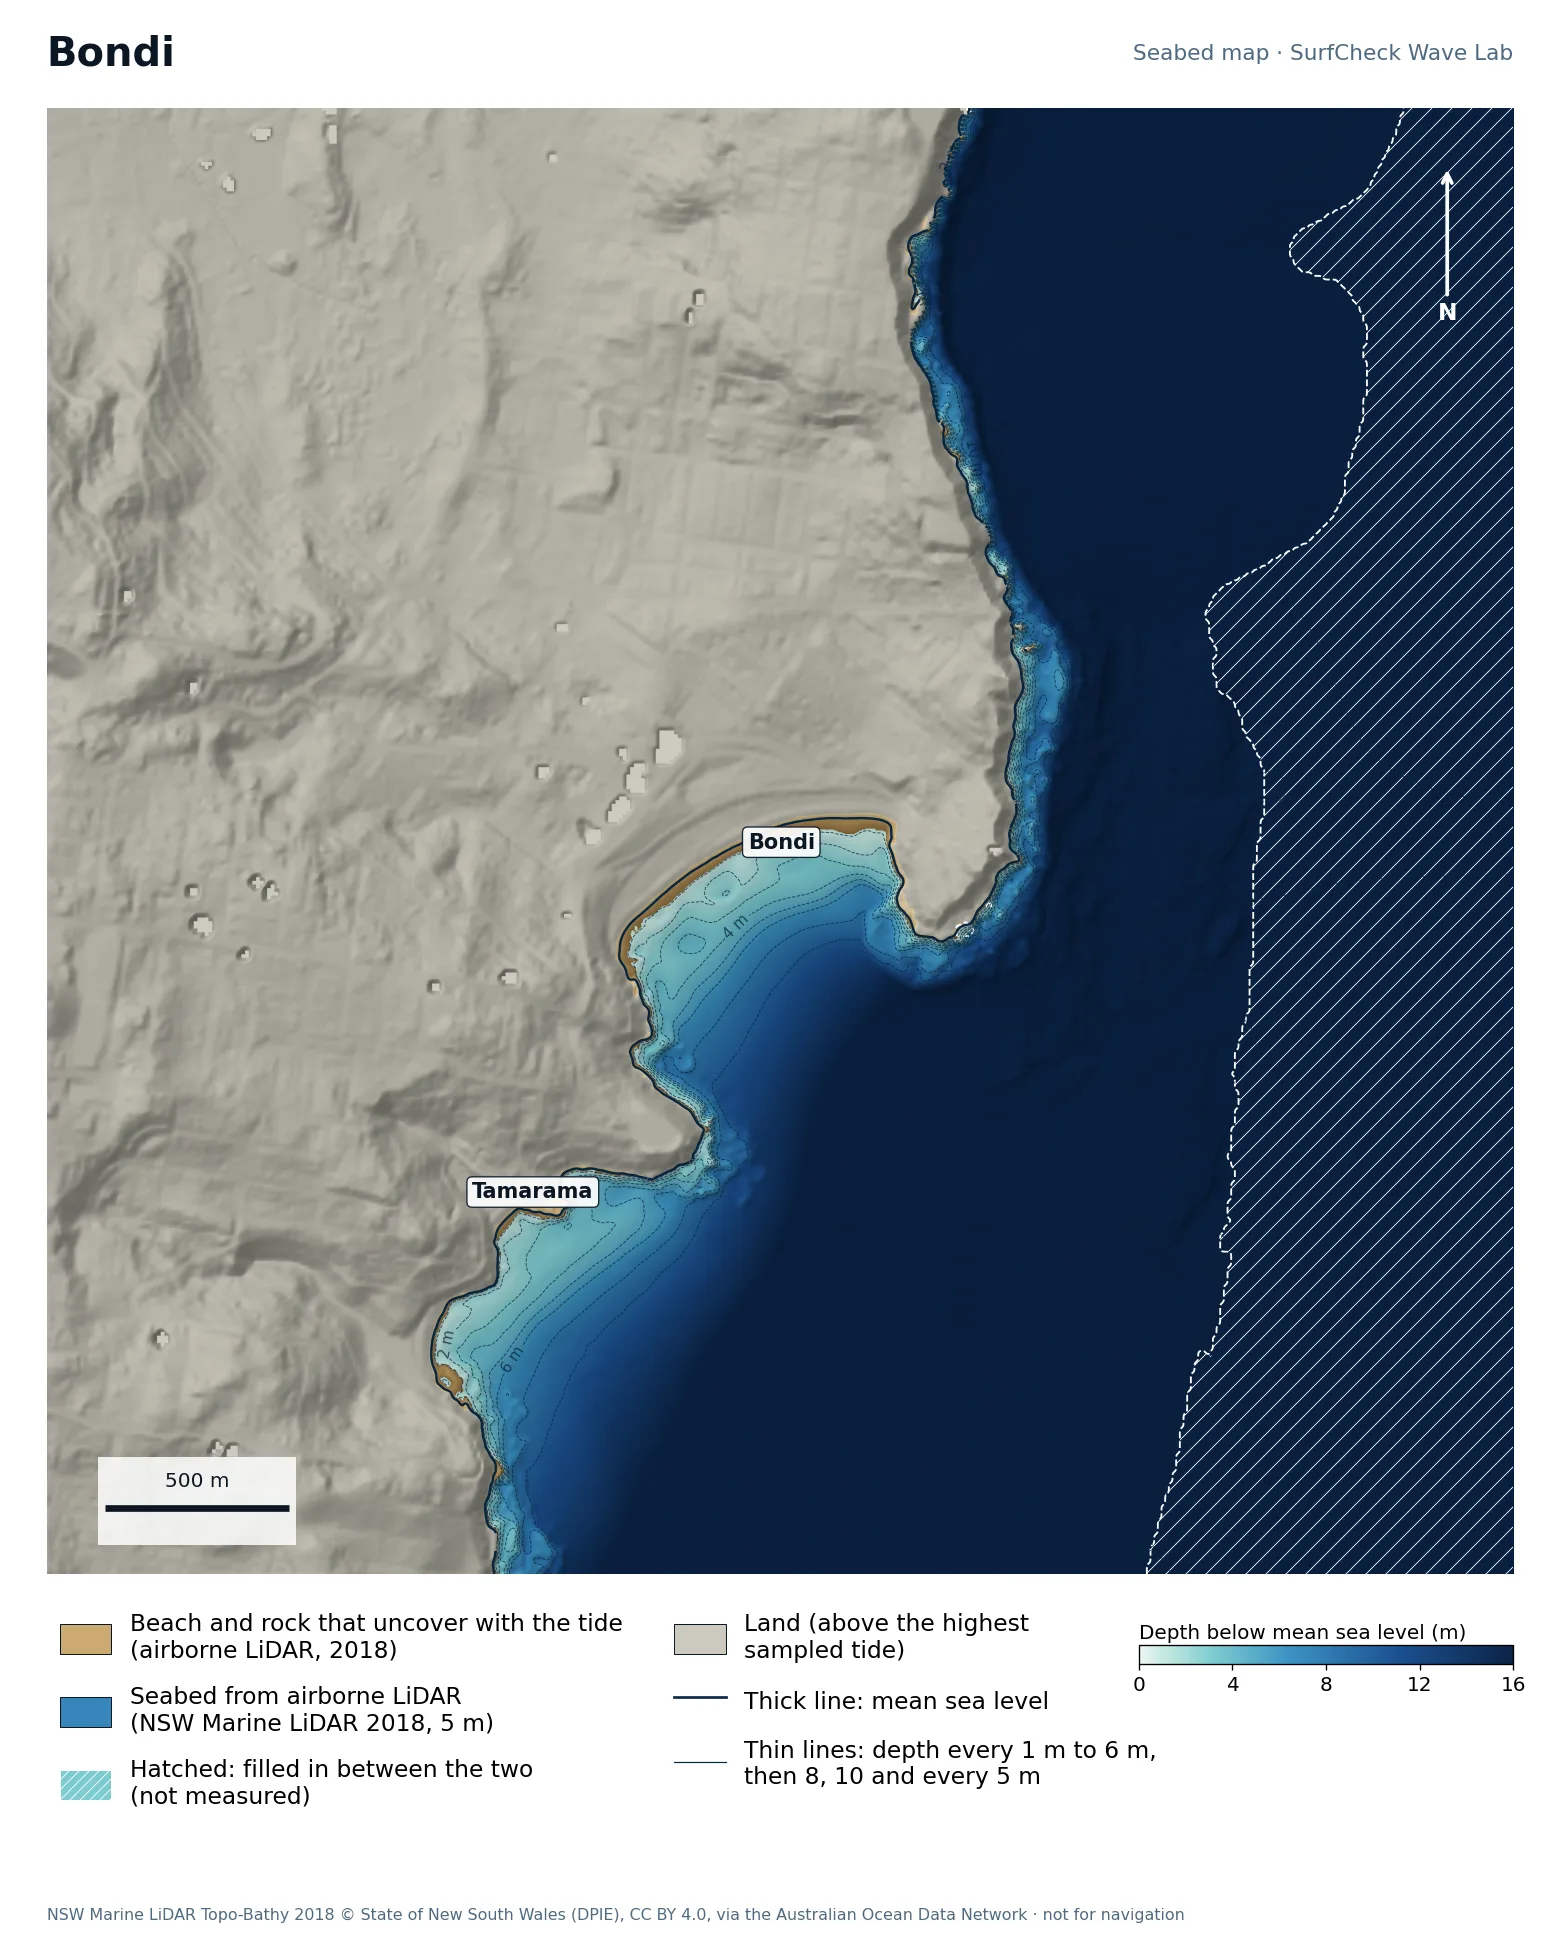
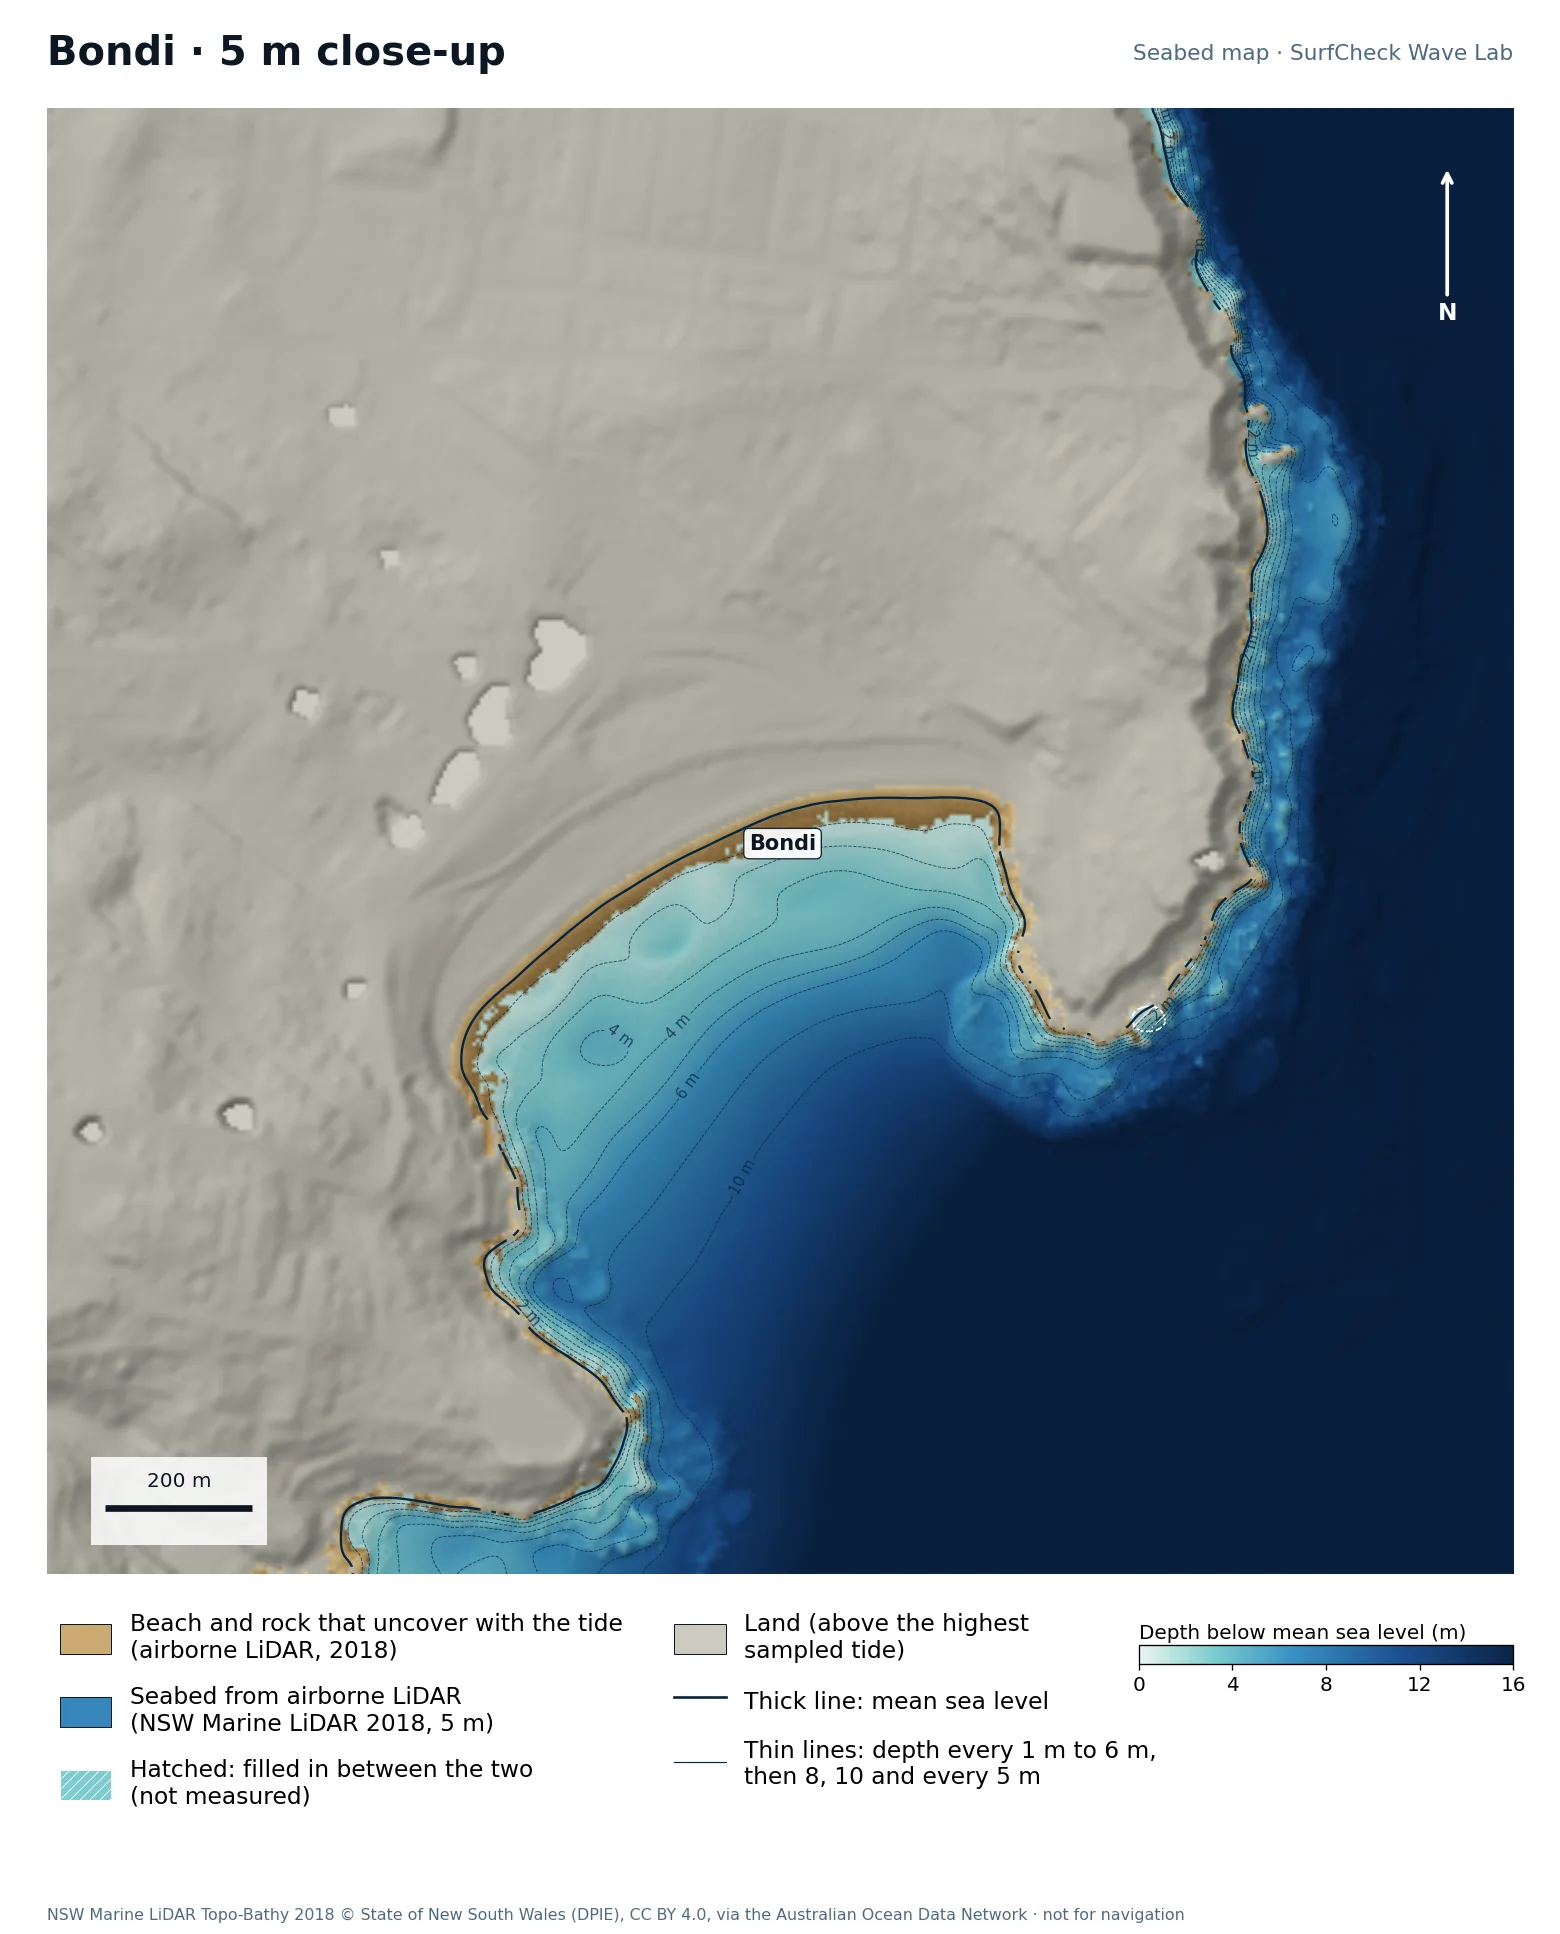
Bondi

Part measured
Seabed map of Bondi: depth contours, the reef or beach that uncovers with the tide, and which parts are measuredClose-up of Bondi in finer detail from LiDAR
66%
of the sea here is measured
10 ha
uncovers with the tide
5 m
airborne LiDAR, 2018
Offshore
only deep water is filled in

What the seabed shows

A short bay between two rock headlands, facing south-east, with Tamarama just to the south. Deep water comes close in off the headlands.

How sure we are

66% of the sea in this map is measured. Beach and seabed both come from one airborne LiDAR survey flown in 2018, at 5 m, out to 20 to 40 m depth. Sand has moved since. The unmeasured third is water too deep for the laser, well outside the surf.

In the Wave Lab

Swell direction is too close to call: the model cannot separate directions that differ by less than about 30% in breaker size. Breakers are about 6% bigger at high tide than at low.
Run it in the Wave Lab

Sydney, New South Wales · Open east-facing beach

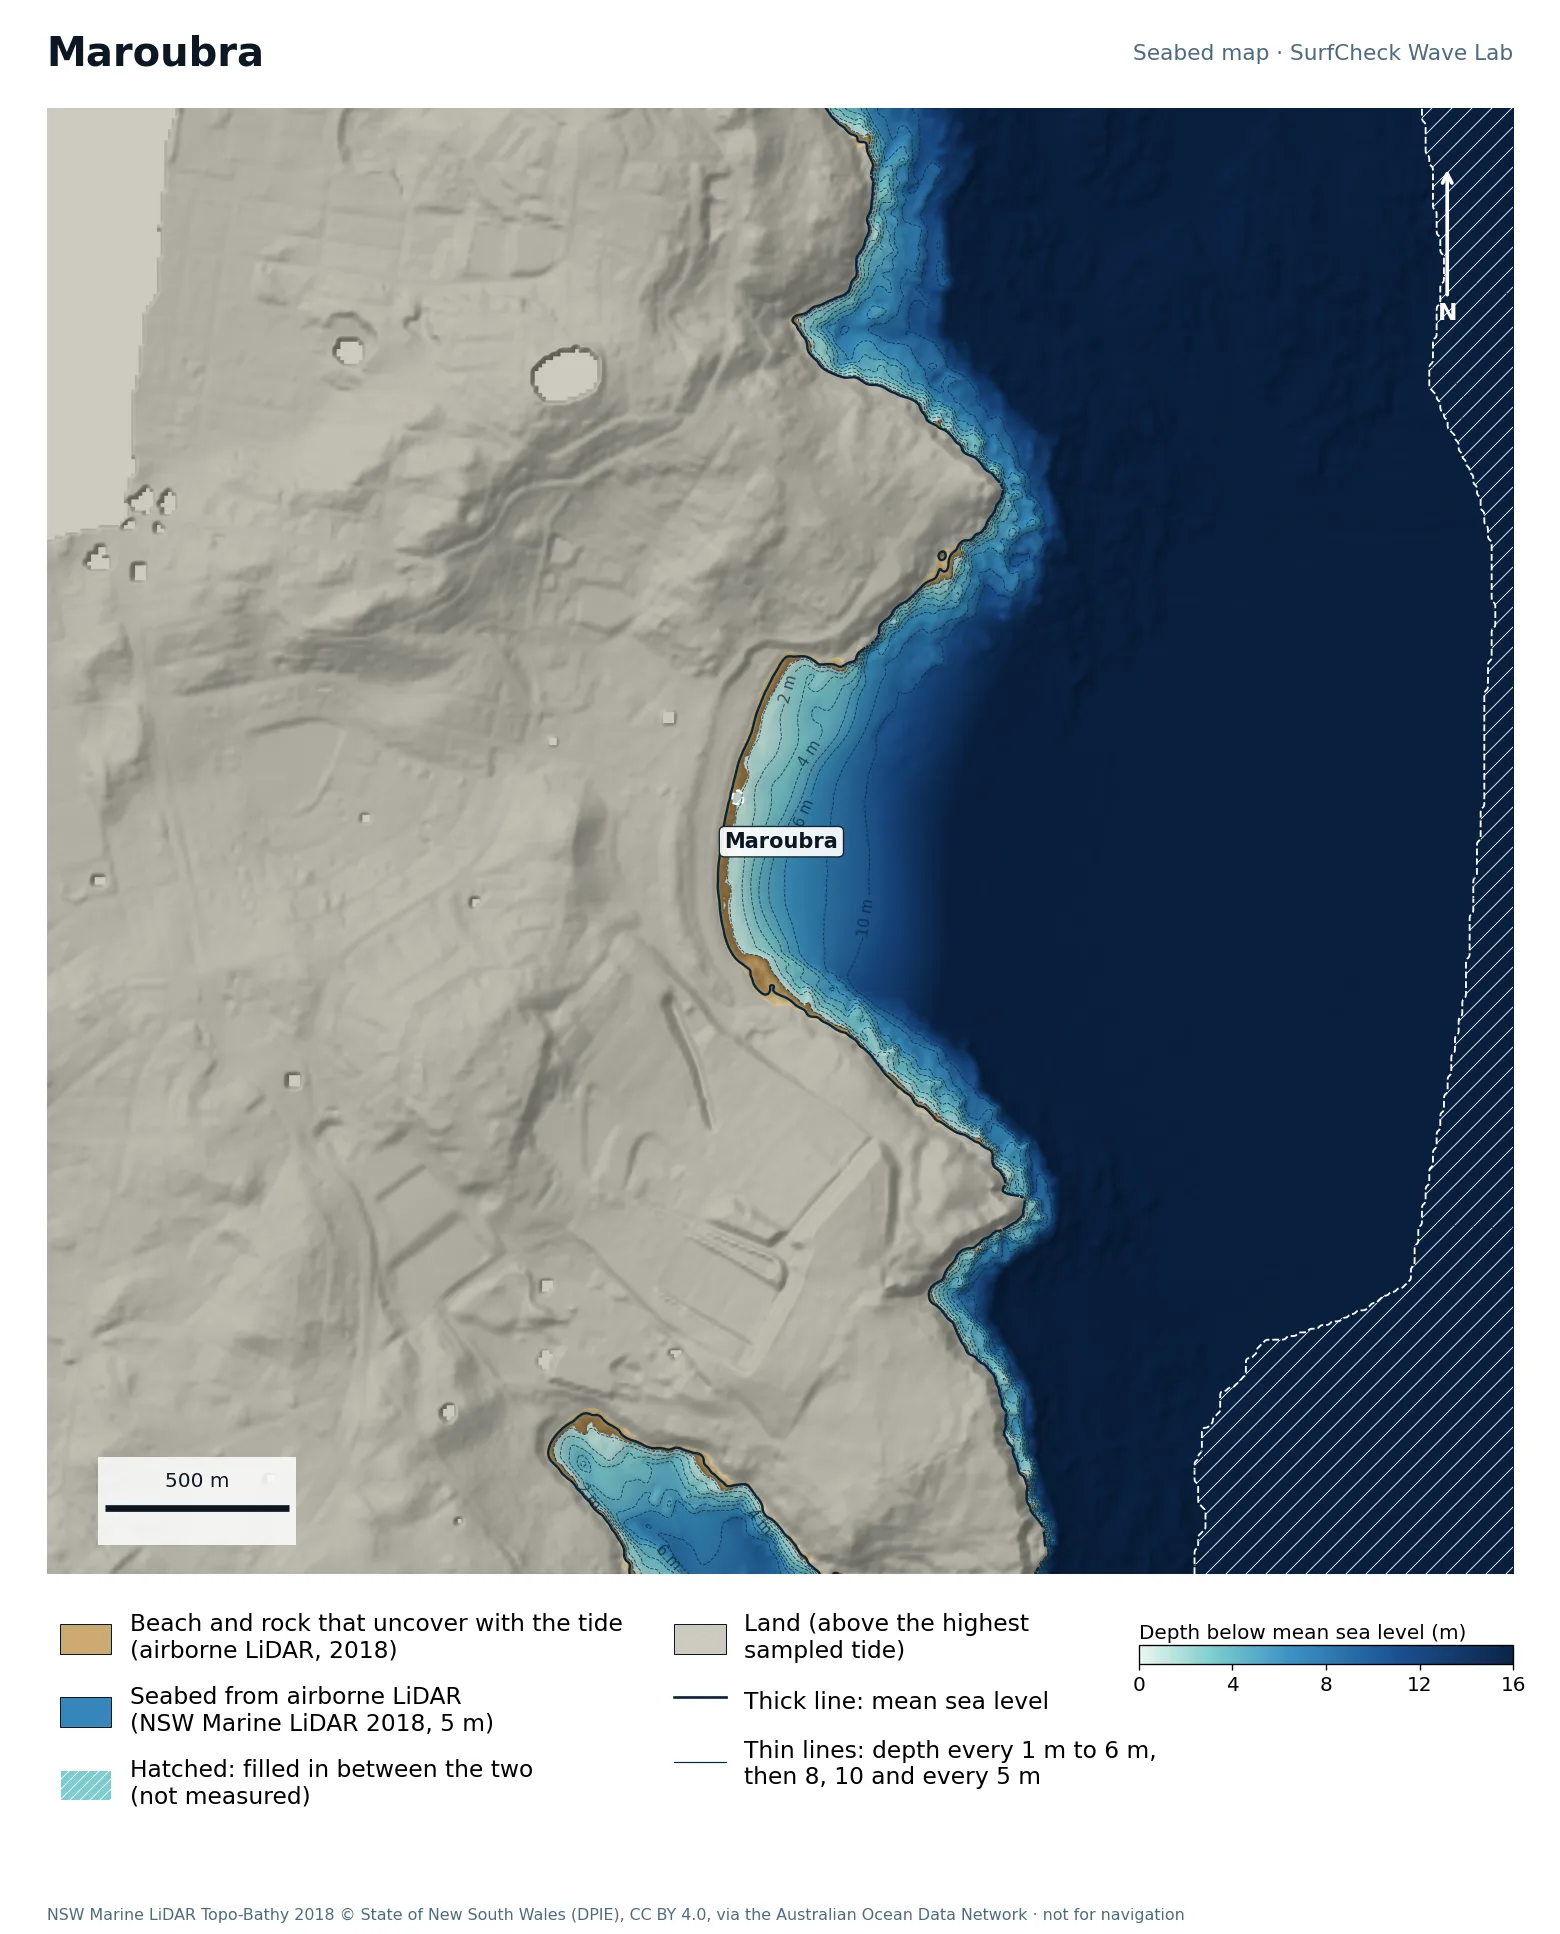
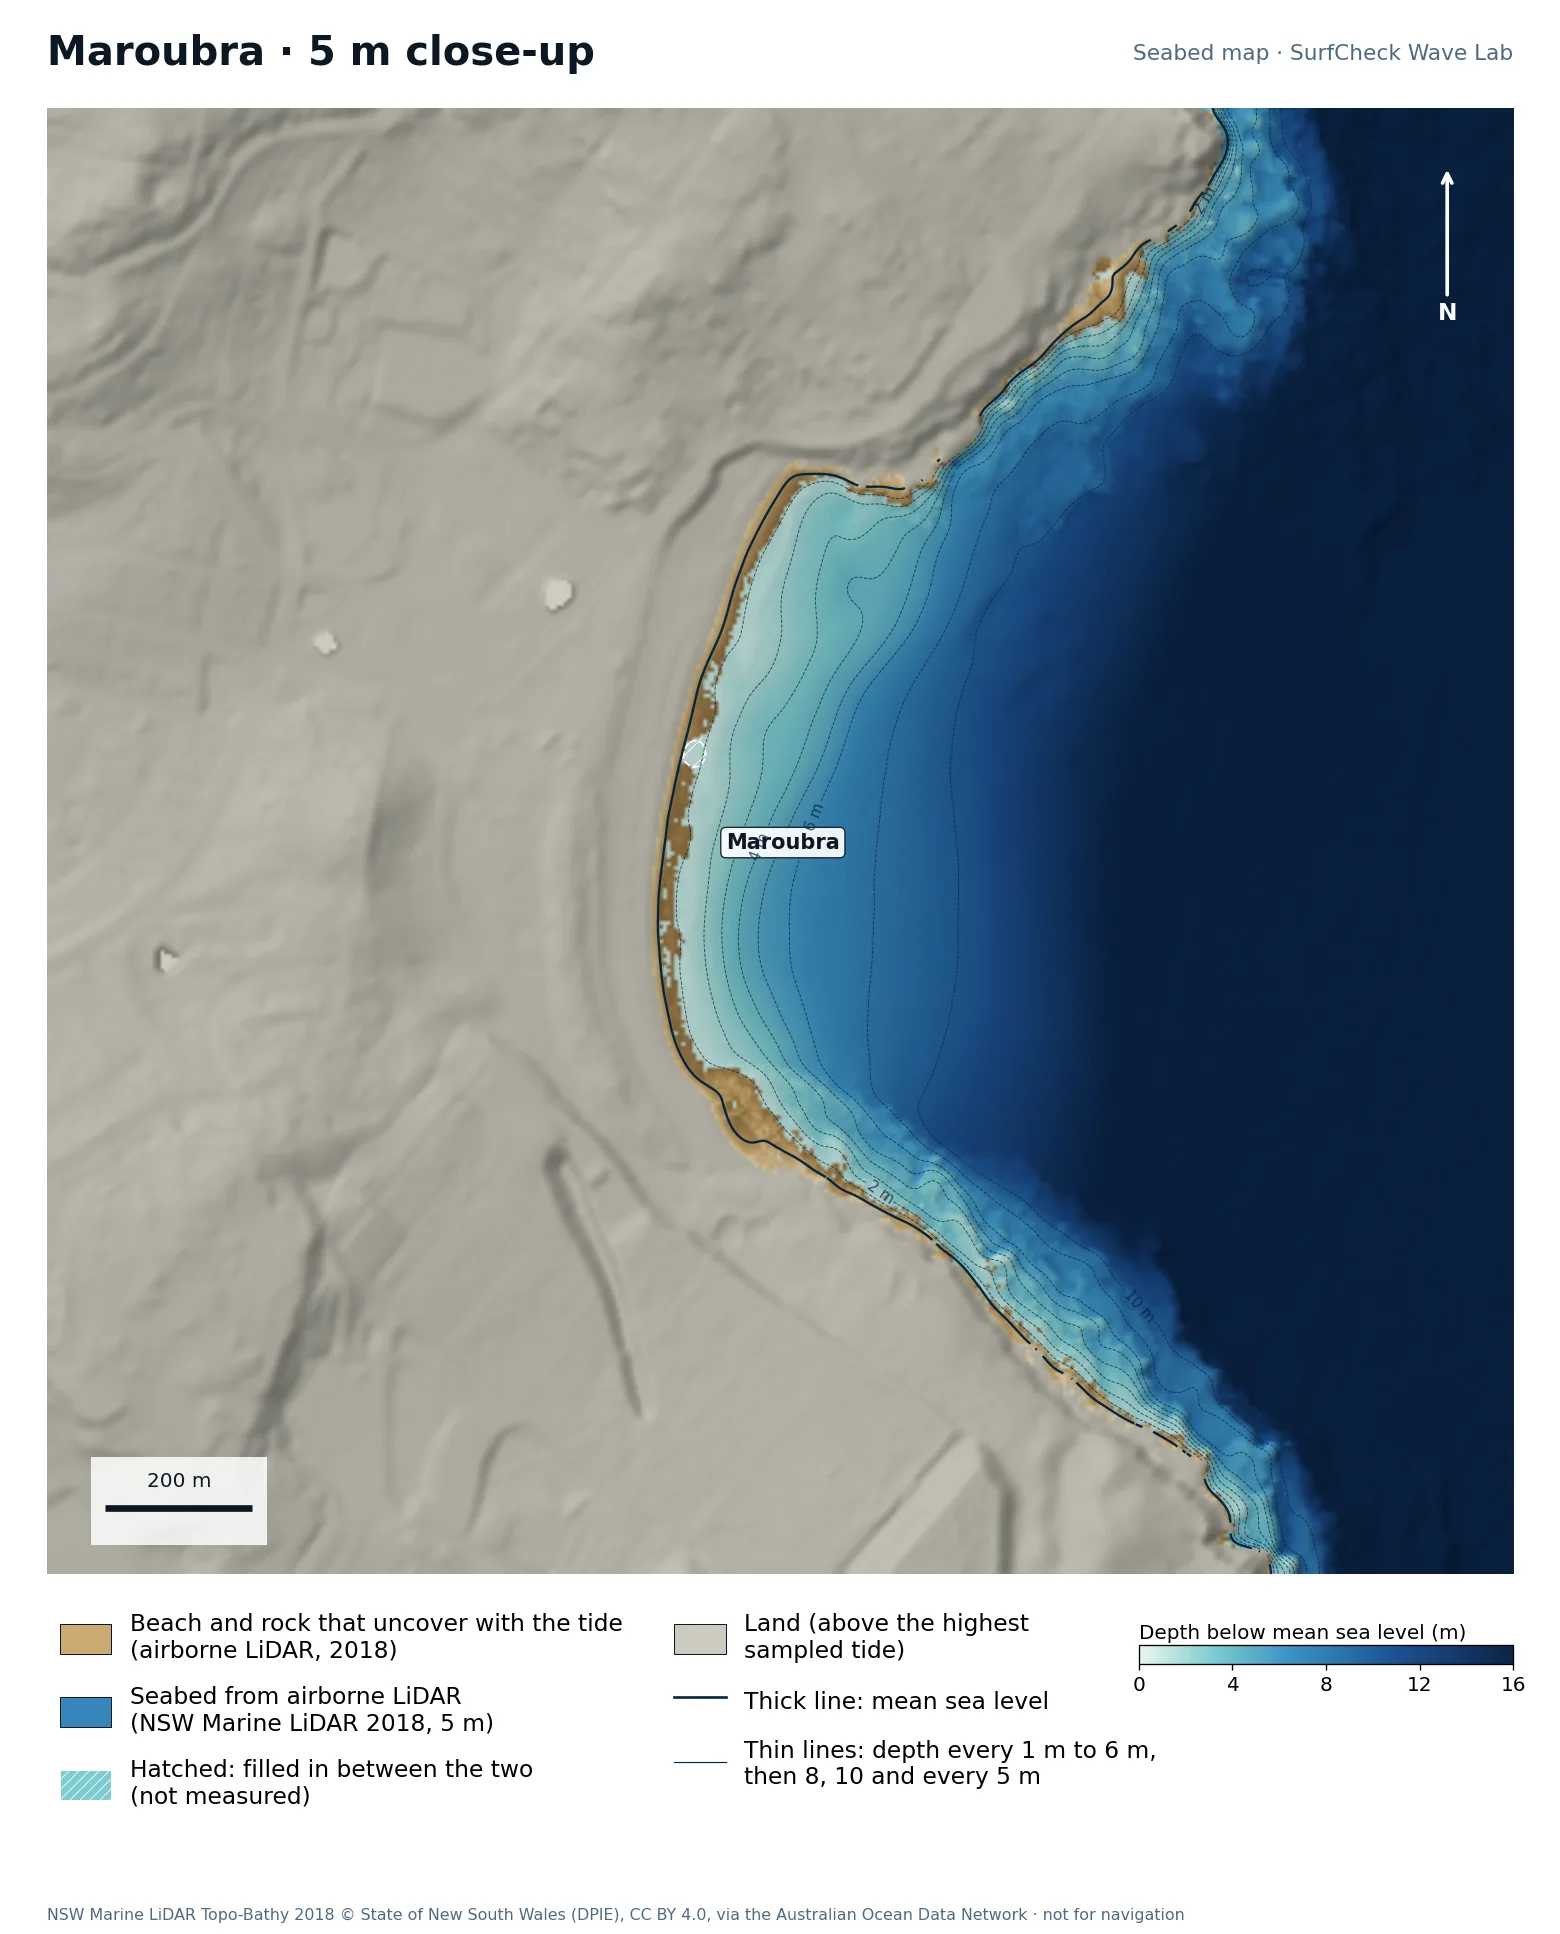
Maroubra

Well measured
Seabed map of Maroubra: depth contours, the reef or beach that uncovers with the tide, and which parts are measuredClose-up of Maroubra in finer detail from LiDAR
85%
of the sea here is measured
11 ha
uncovers with the tide
5 m
airborne LiDAR, 2018
Offshore
only deep water is filled in

What the seabed shows

A kilometre of beach between two headlands, more exposed than Bondi.
How sure we are

85% of the sea in this map is measured. Beach and seabed both come from one airborne LiDAR survey flown in 2018, at 5 m, out to 20 to 40 m depth. Sand has moved since. The unmeasured part is deep water offshore.

In the Wave Lab

Swell direction is too close to call: the model cannot separate directions that differ by less than about 30% in breaker size. Tide changes breaker size by under 4%.

Run it in the Wave Lab

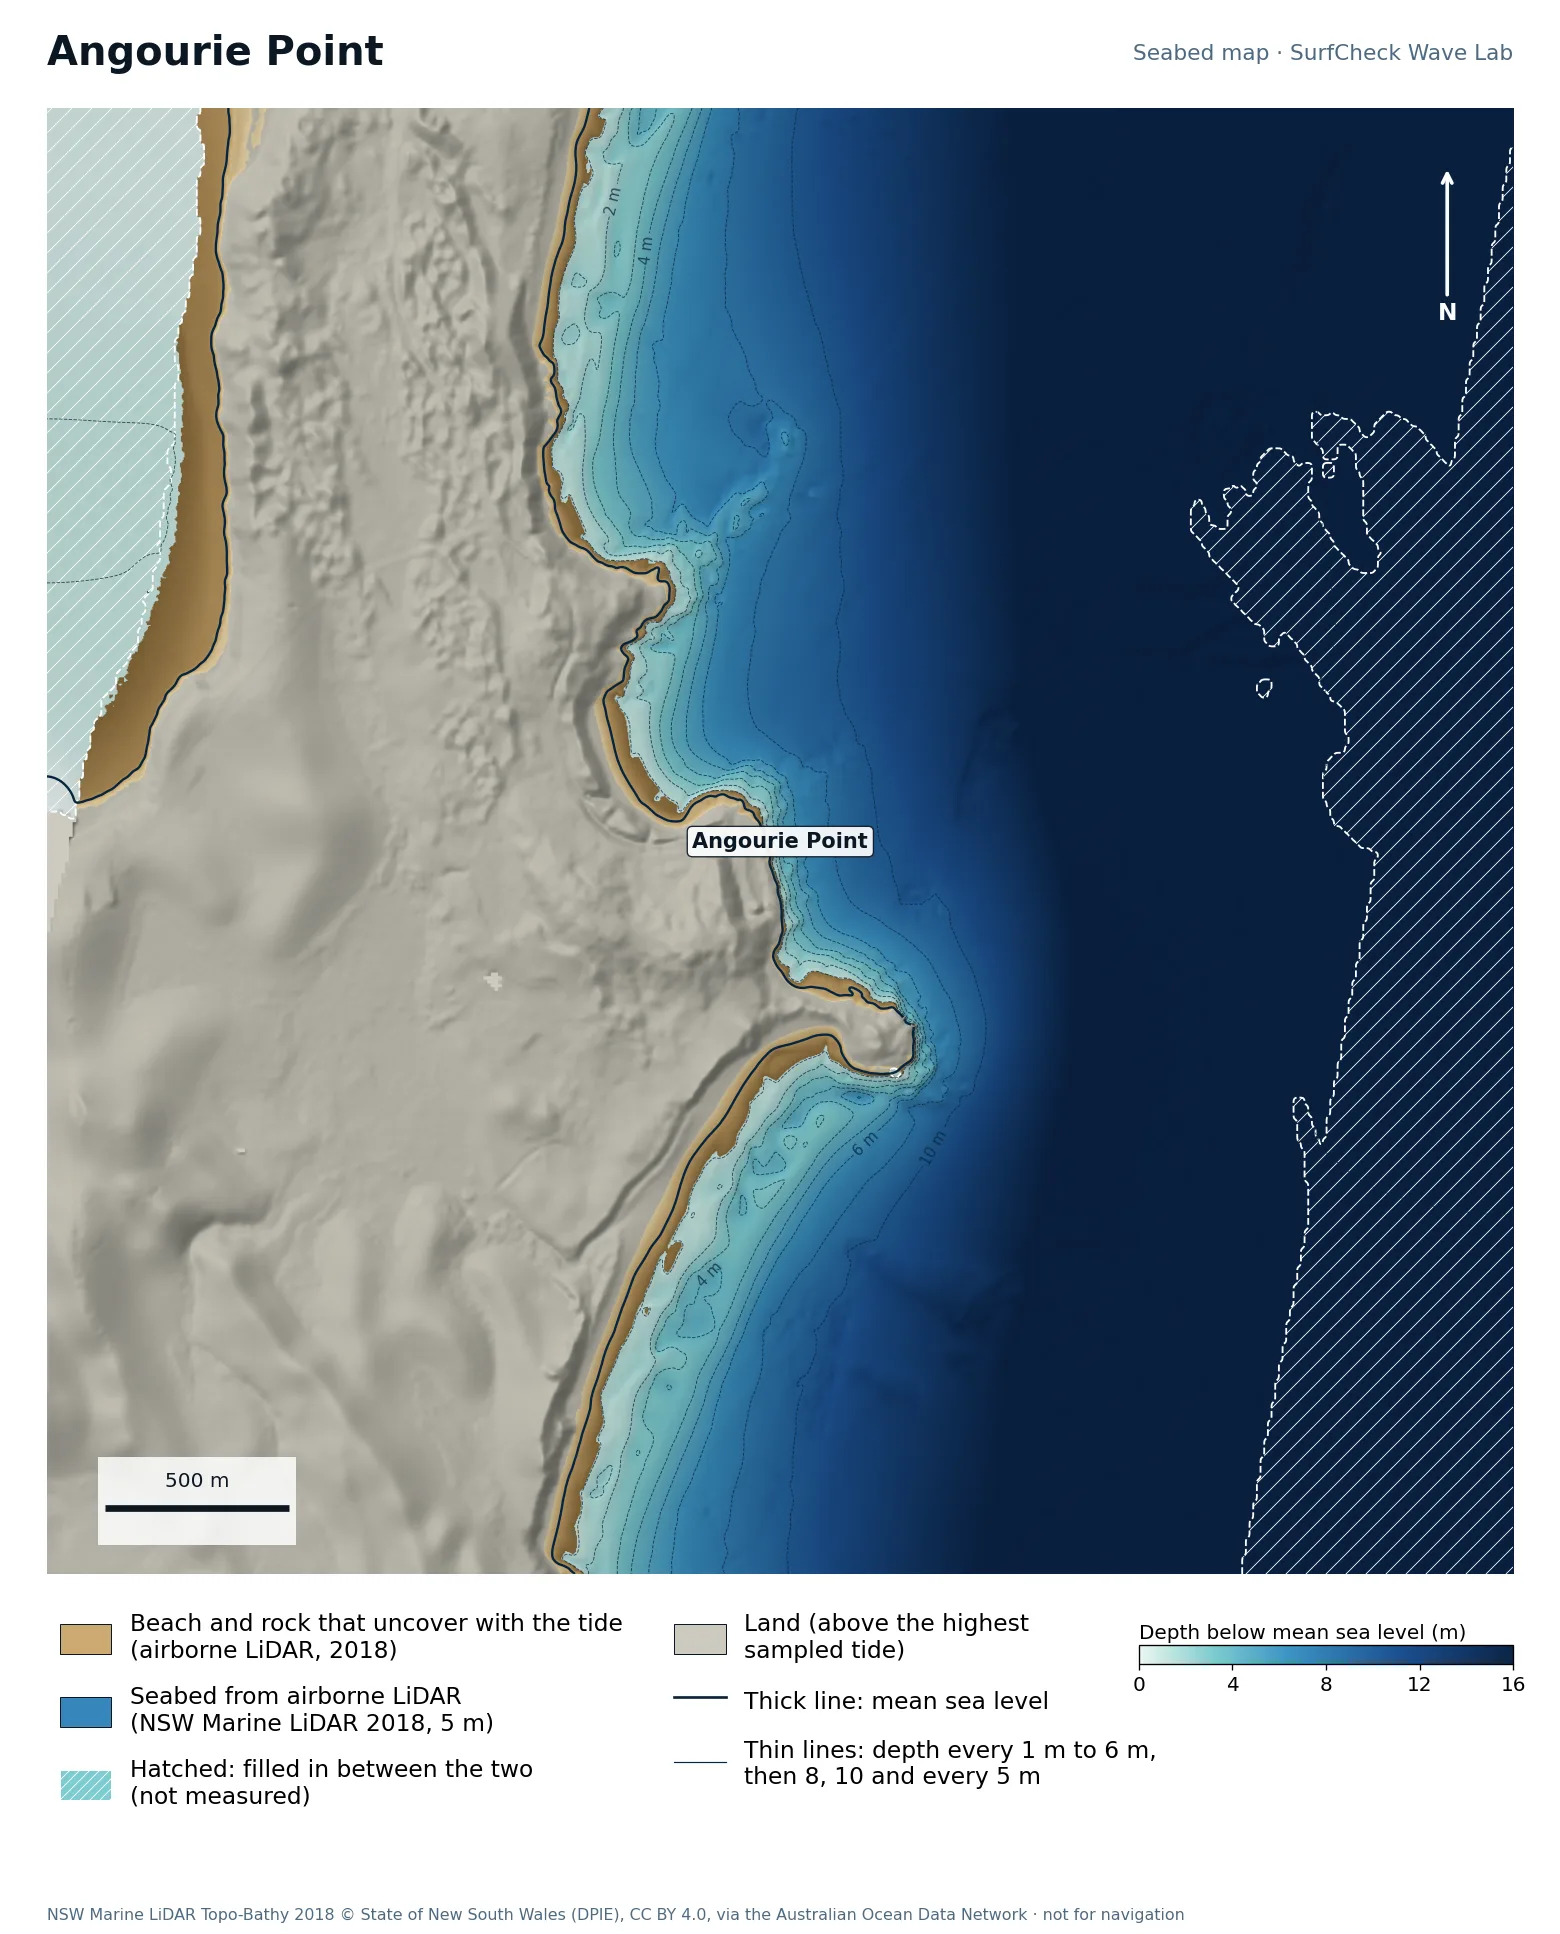
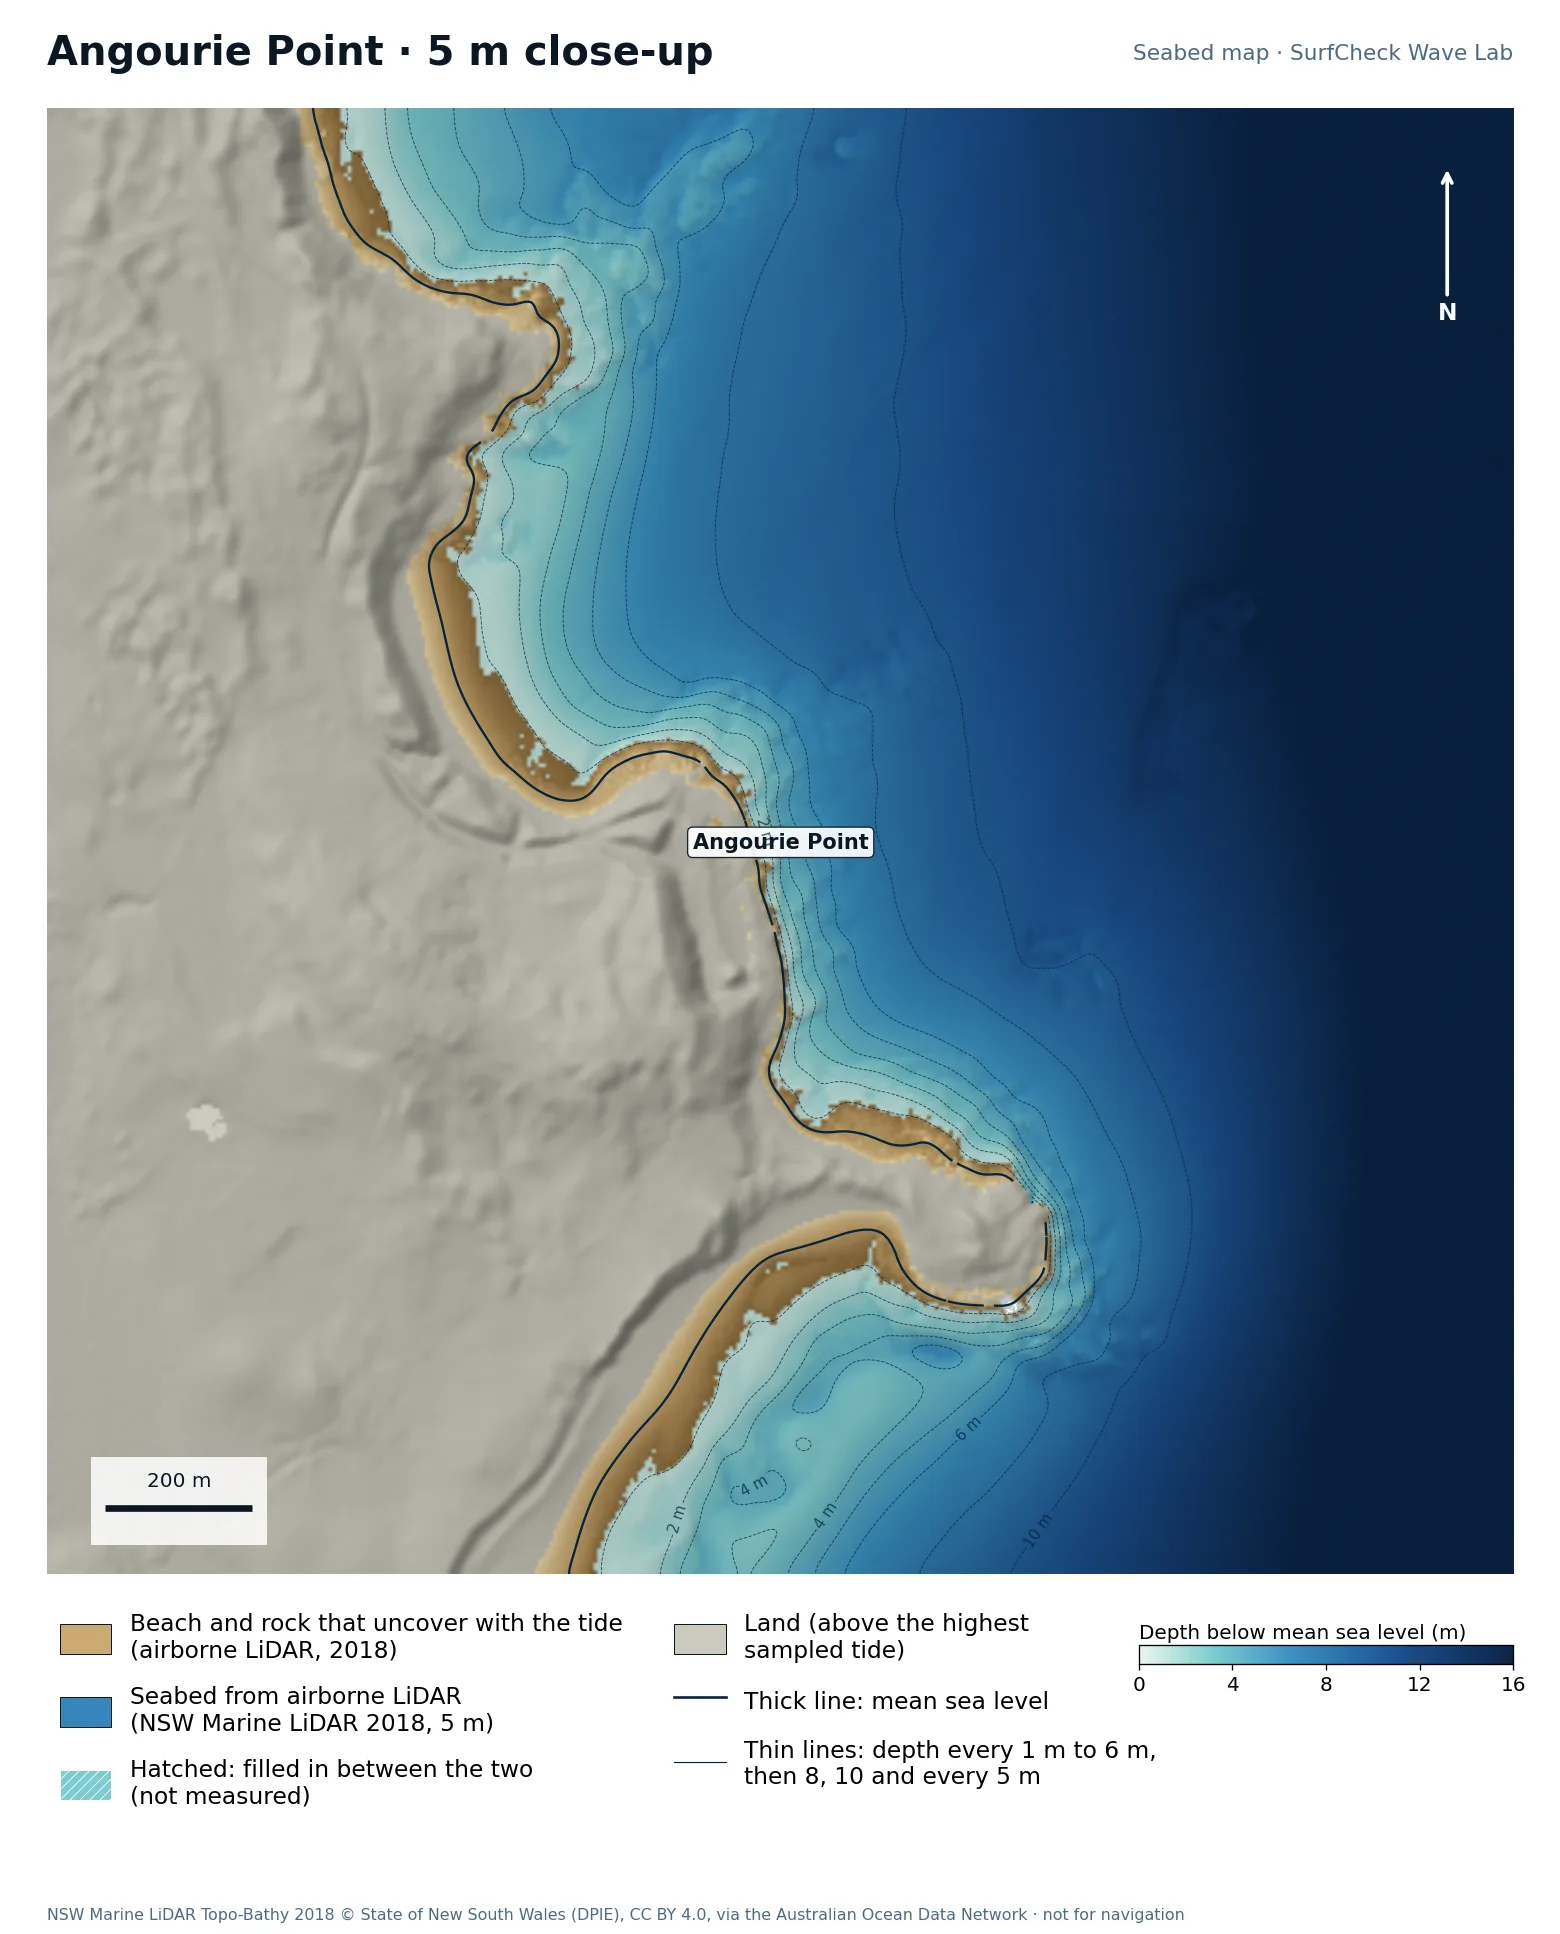
Yamba, New South Wales · Rock point

Angourie

Well measured
Seabed map of Angourie: depth contours, the reef or beach that uncovers with the tide, and which parts are measuredClose-up of Angourie in finer detail from LiDAR
77%
of the sea here is measured
55 ha
uncovers with the tide
5 m
airborne LiDAR, 2018
Offshore
only deep water is filled in

What the seabed shows

A low rocky point south of the Clarence River mouth, with reef ledges along its foot and beaches either side.

How sure we are

77% of the sea in this map is measured. Beach and seabed both come from one airborne LiDAR survey flown in 2018, at 5 m, out to 20 to 40 m depth. Sand has moved since. The unmeasured part is deeper water offshore and patches the laser missed.

In the Wave Lab

Biggest on swell from roughly 50° (+17% against its own average) and smallest from 160° (-35%). Tested for swell from 40° to 160°, with the seabed turned to face each direction. Overlapping tests agree within about 4%.

Run it in the Wave Lab

New South Wales · Long right point

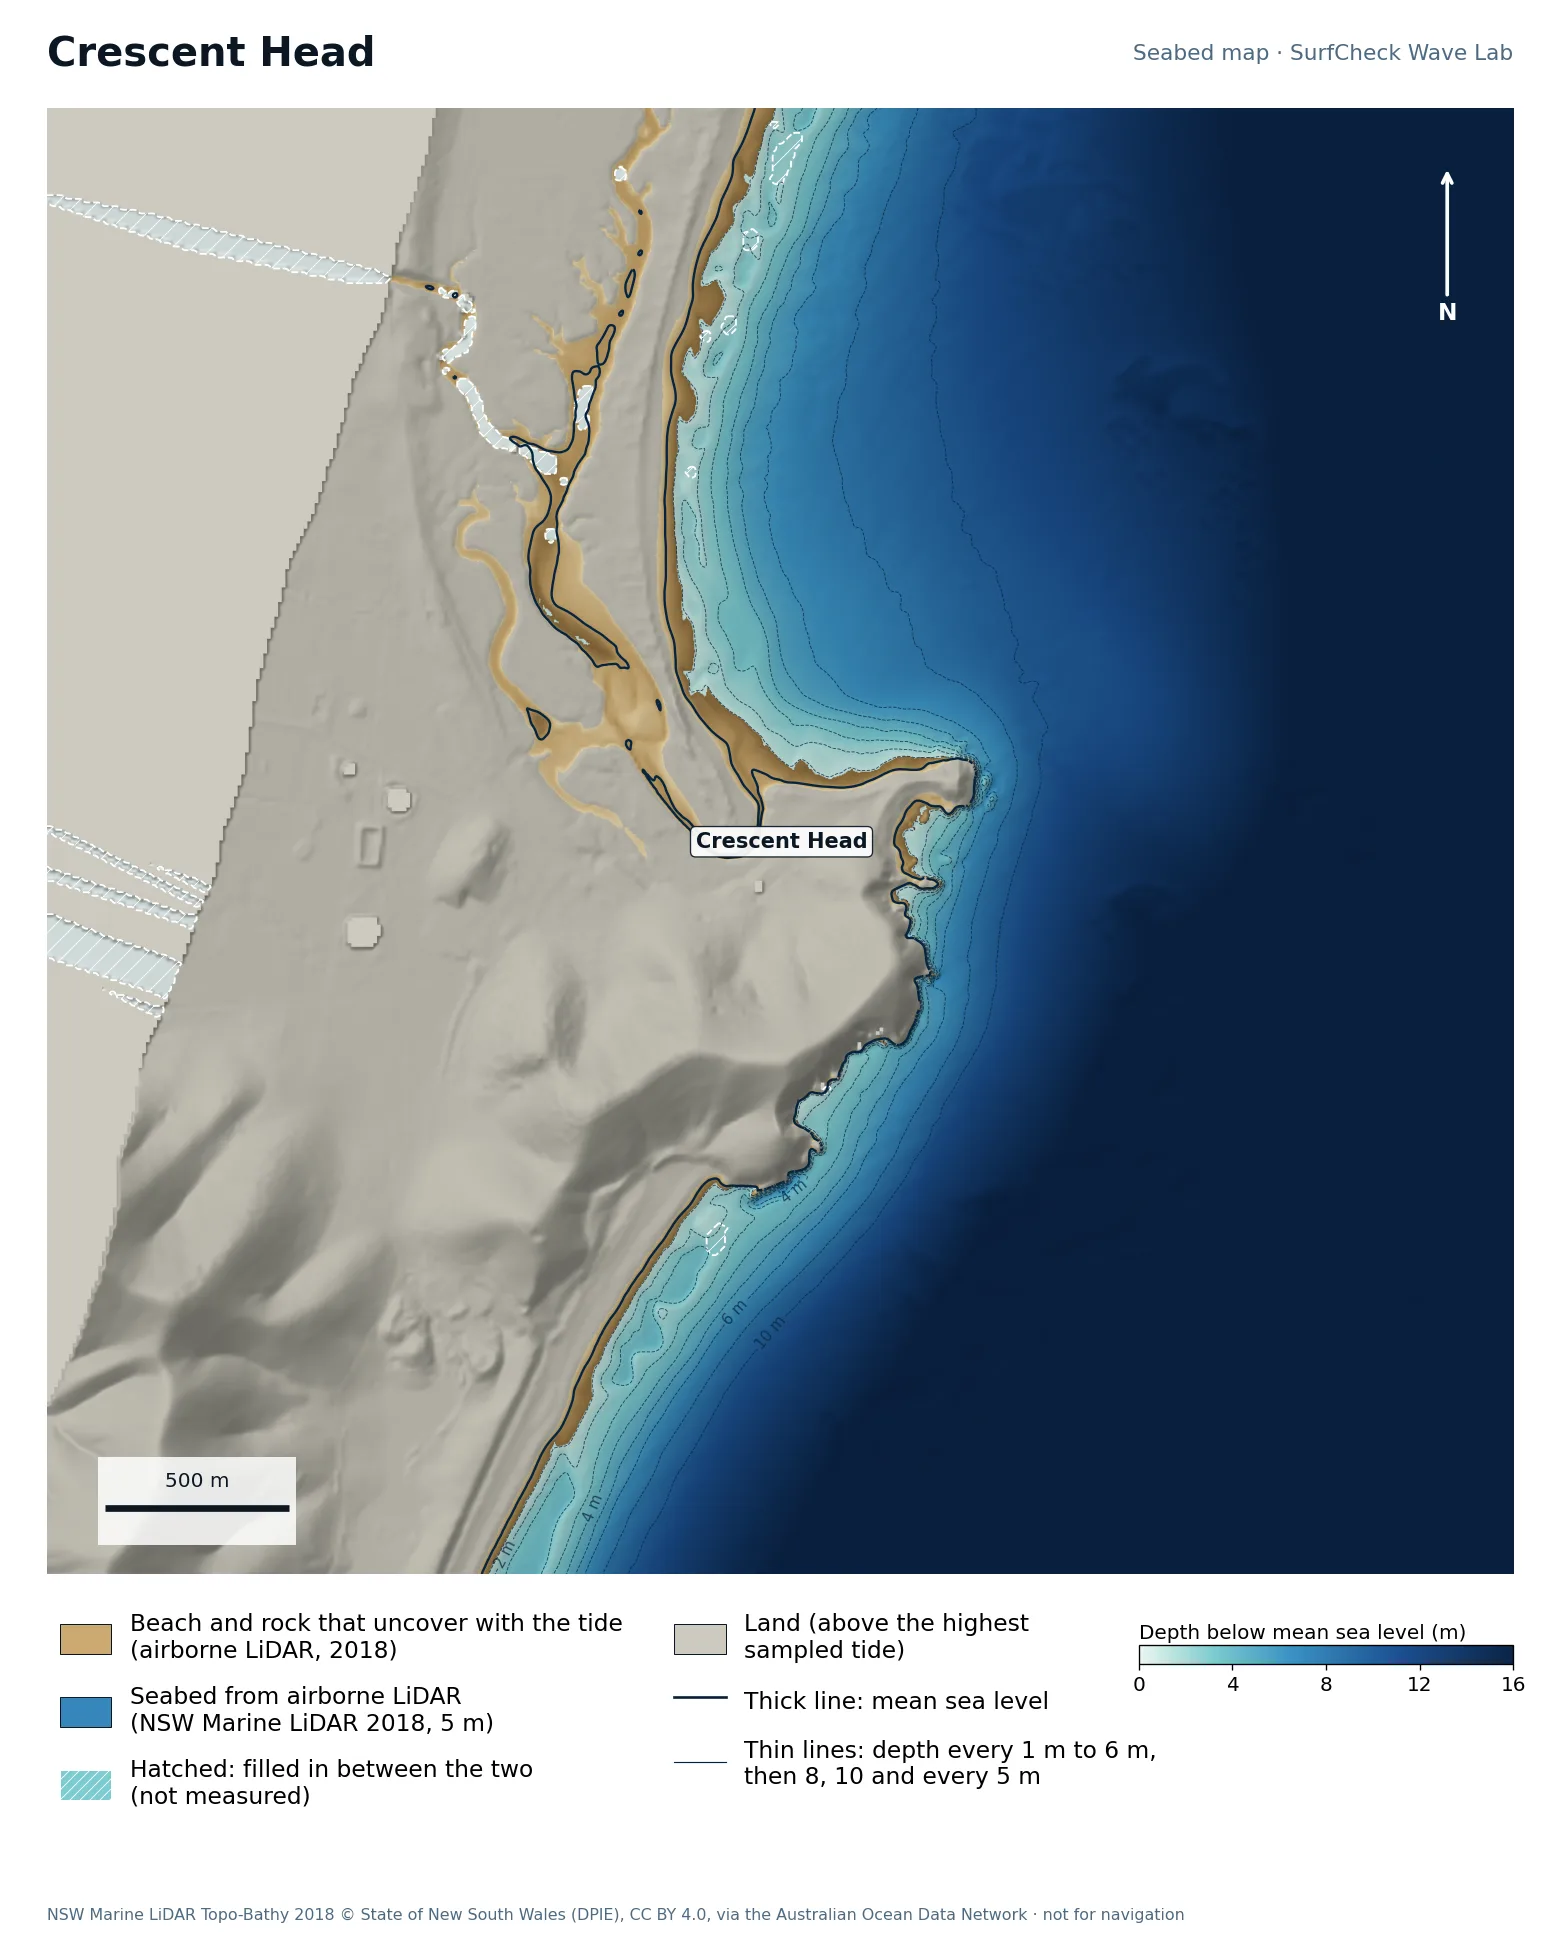
Crescent Head

Well measured
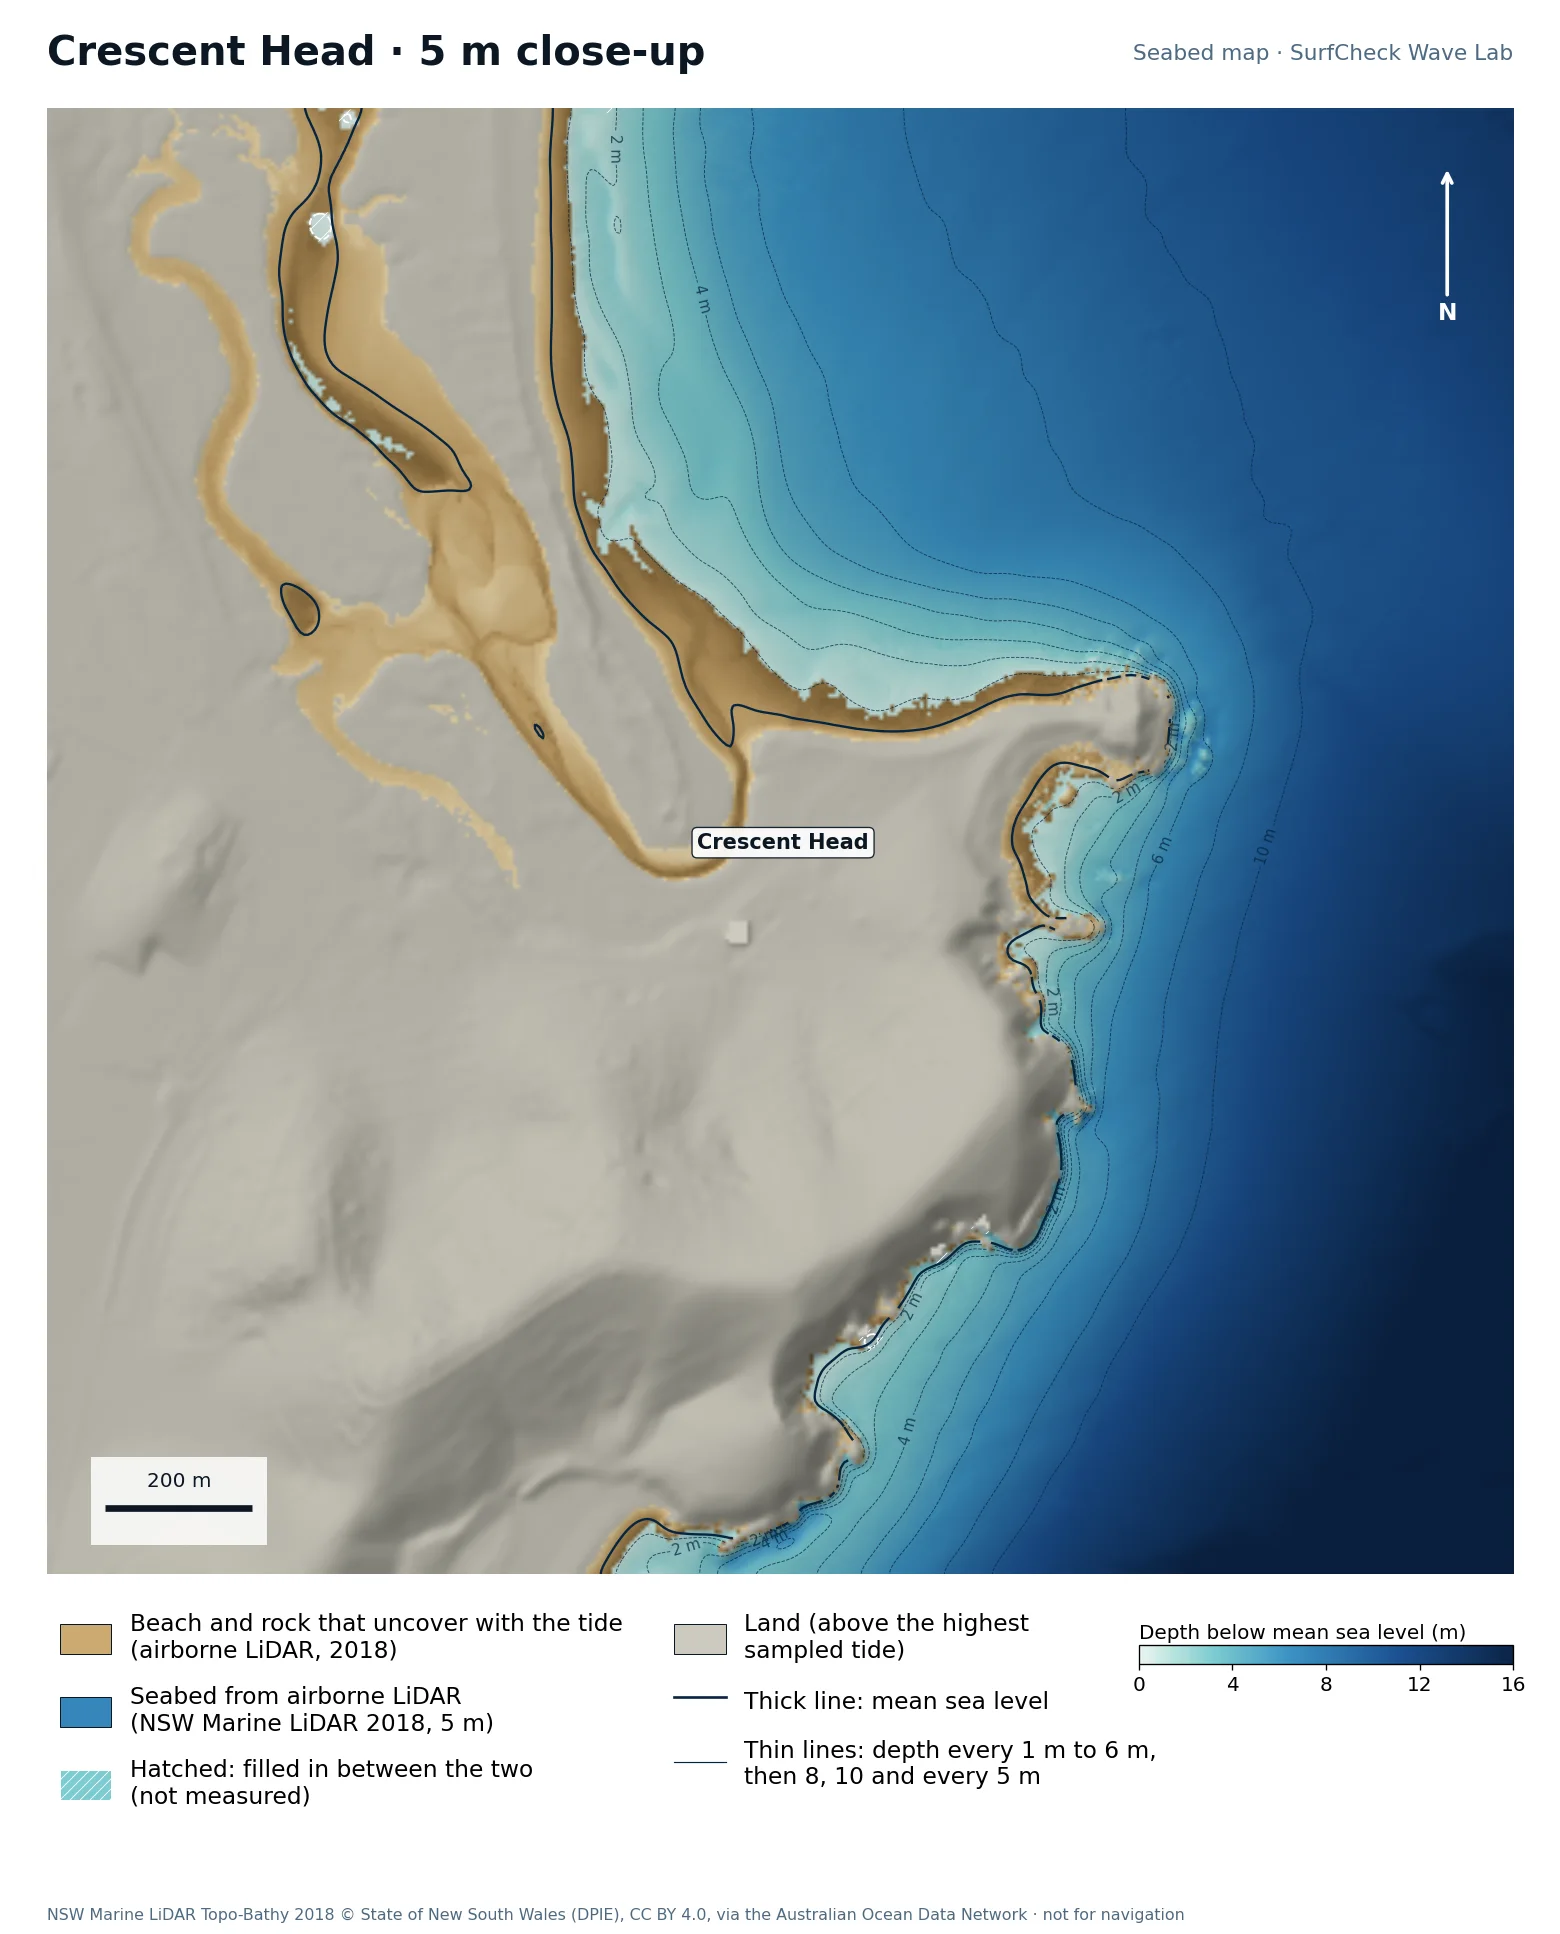
Seabed map of Crescent Head: depth contours, the reef or beach that uncovers with the tide, and which parts are measuredClose-up of Crescent Head in finer detail from LiDAR
98%
of the sea here is measured
52 ha
uncovers with the tide
5 m
airborne LiDAR, 2018
None
filled-in band, typical width

What the seabed shows

A headland with a creek mouth on its north side and cobble and sand running along the point into a long beach.

How sure we are

98% of the sea in this map is measured. Beach and seabed both come from one airborne LiDAR survey flown in 2018, at 5 m, out to 20 to 40 m depth. Sand has moved since.

In the Wave Lab

Direction not ranked. Where two turnings of the seabed cover the same swell direction, their answers differ by about 25%, which is too far apart to publish.

Run it in the Wave Lab

Newcastle, New South Wales · Rock reef and beach

Merewether

Well measured
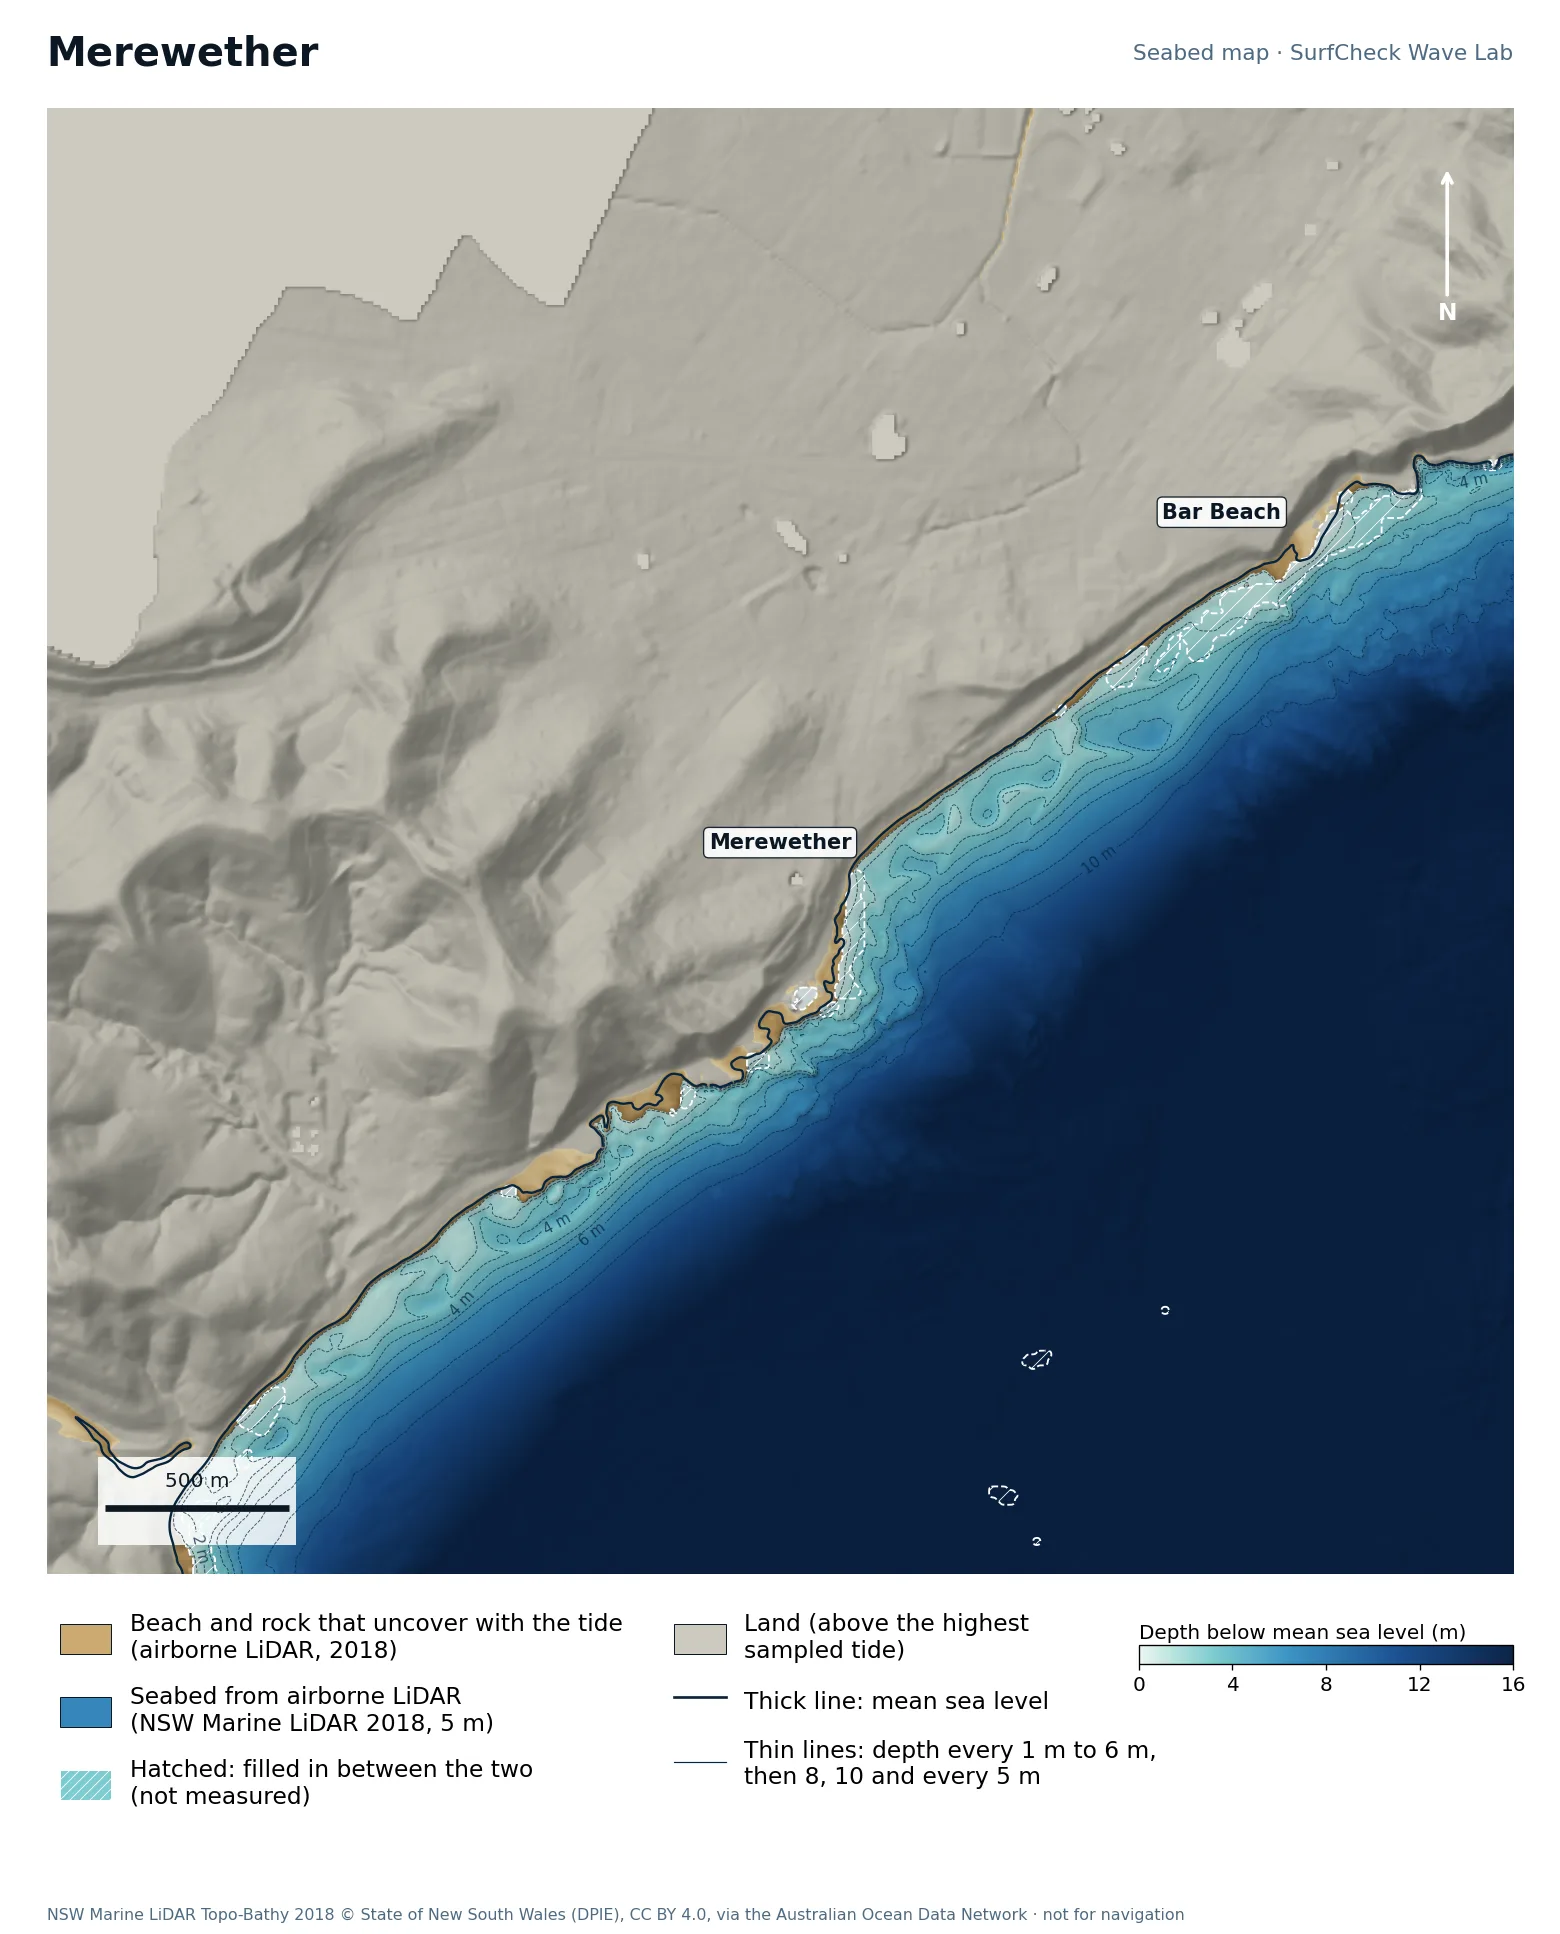
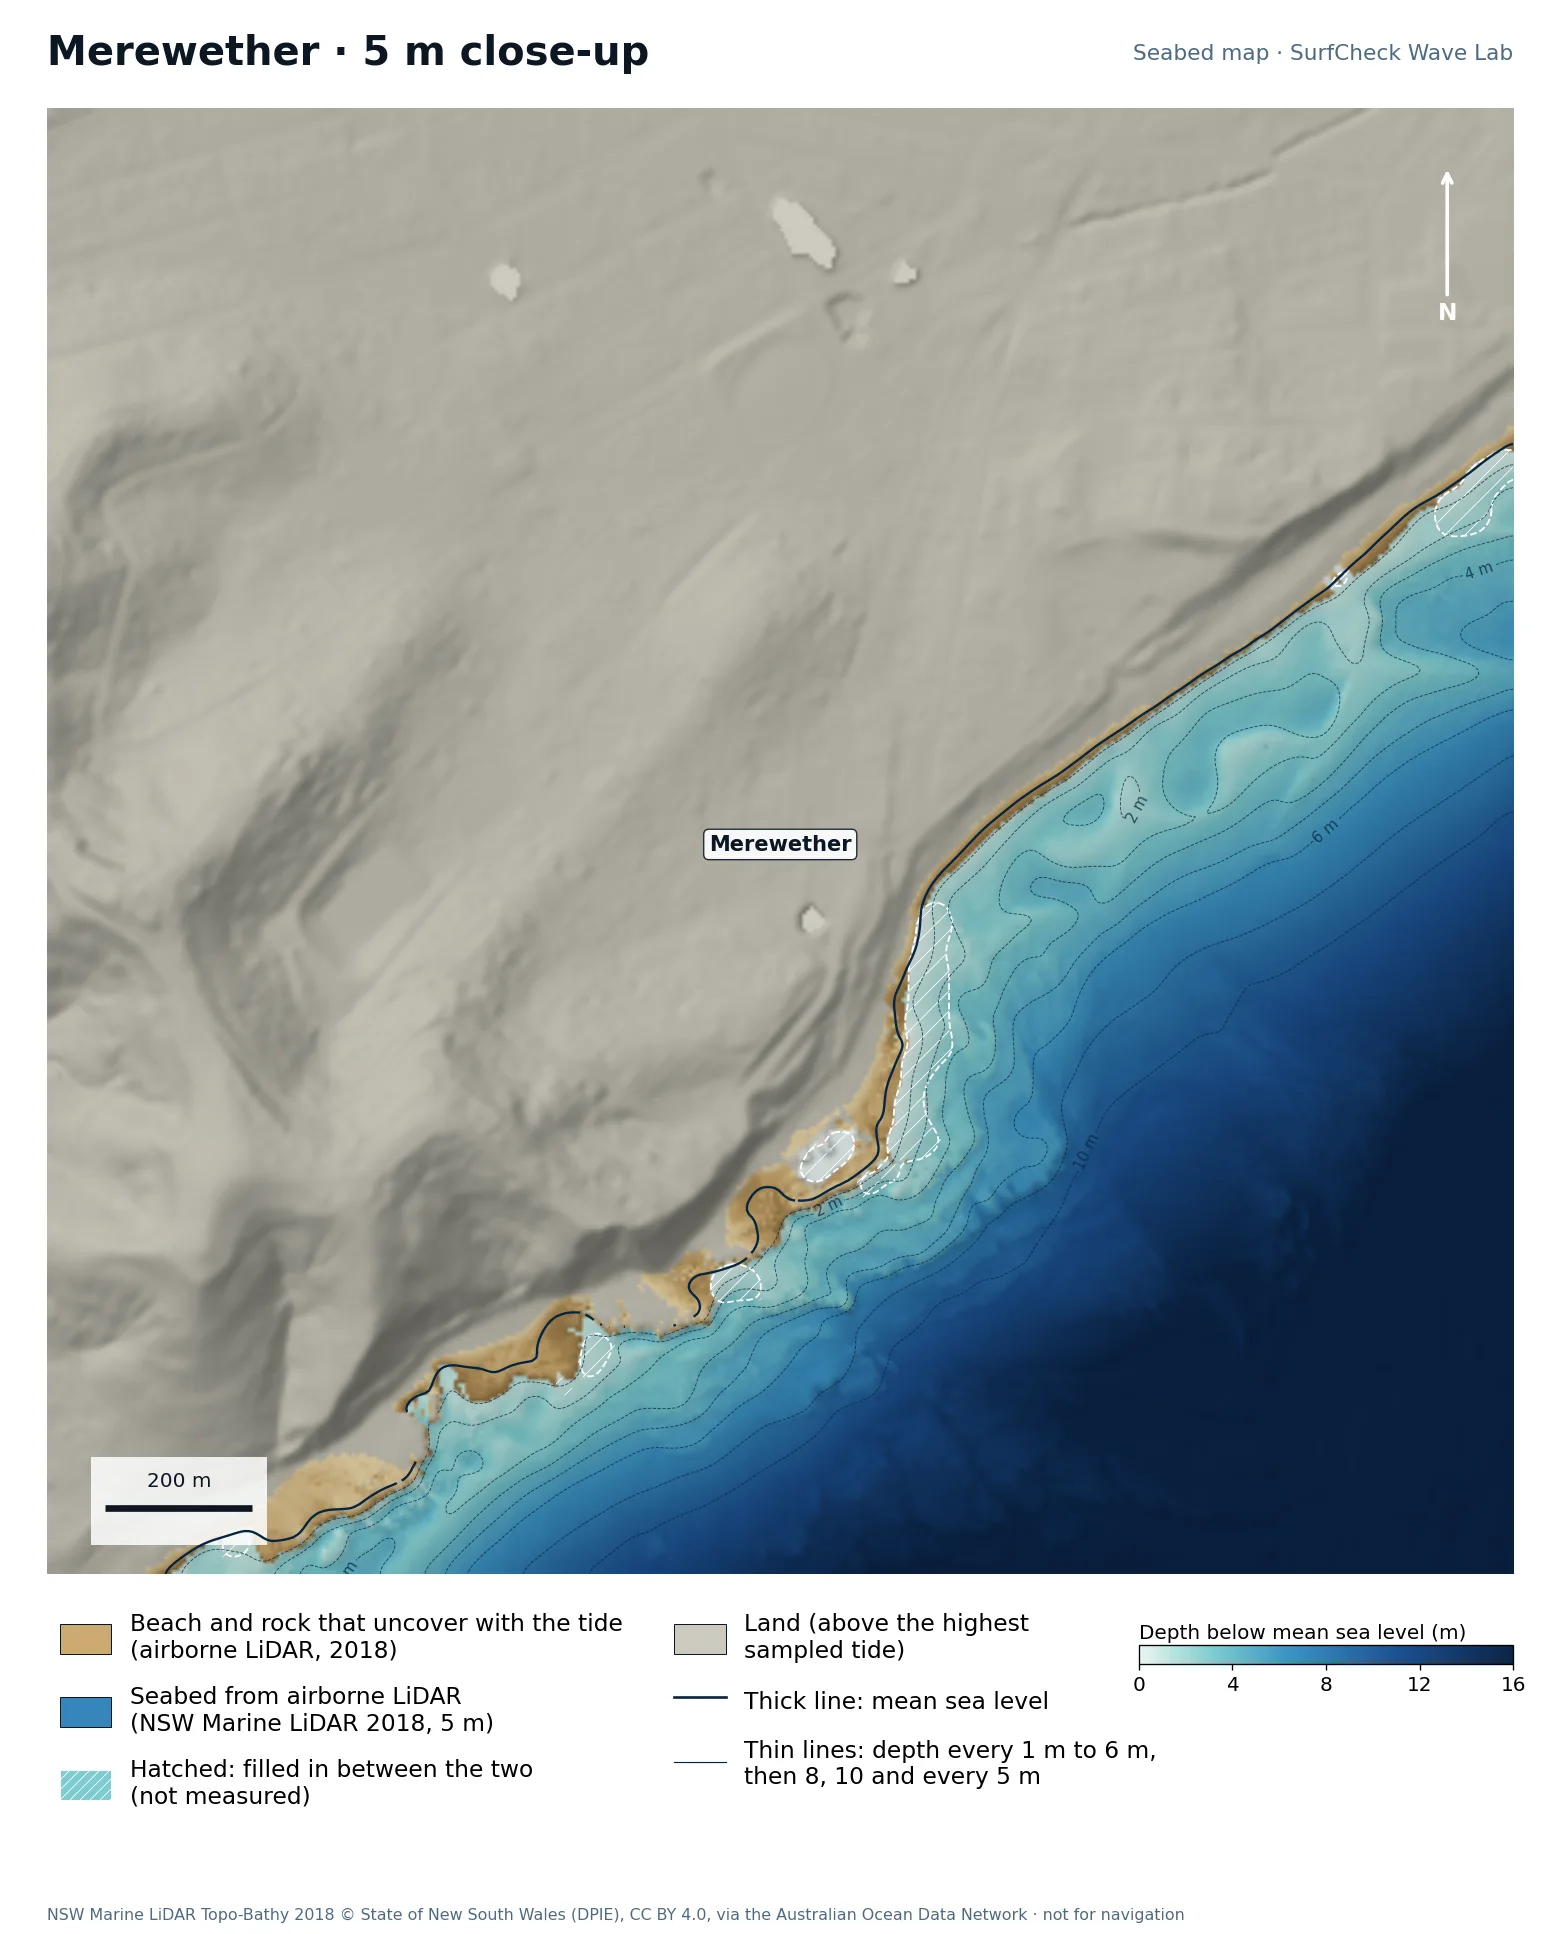
Seabed map of Merewether: depth contours, the reef or beach that uncovers with the tide, and which parts are measuredClose-up of Merewether in finer detail from LiDAR
98%
of the sea here is measured
17 ha
uncovers with the tide
5 m
airborne LiDAR, 2018
None
filled-in band, typical width

What the seabed shows

A rock platform and ledges at the south end of the beach that runs north through Dixon Park to Bar Beach.

How sure we are

98% of the sea in this map is measured. Beach and seabed both come from one airborne LiDAR survey flown in 2018, at 5 m, out to 20 to 40 m depth. Sand has moved since.

In the Wave Lab

Swell direction is too close to call: the model cannot separate directions that differ by less than about 30% in breaker size. Tide changes breaker size by under 4%.

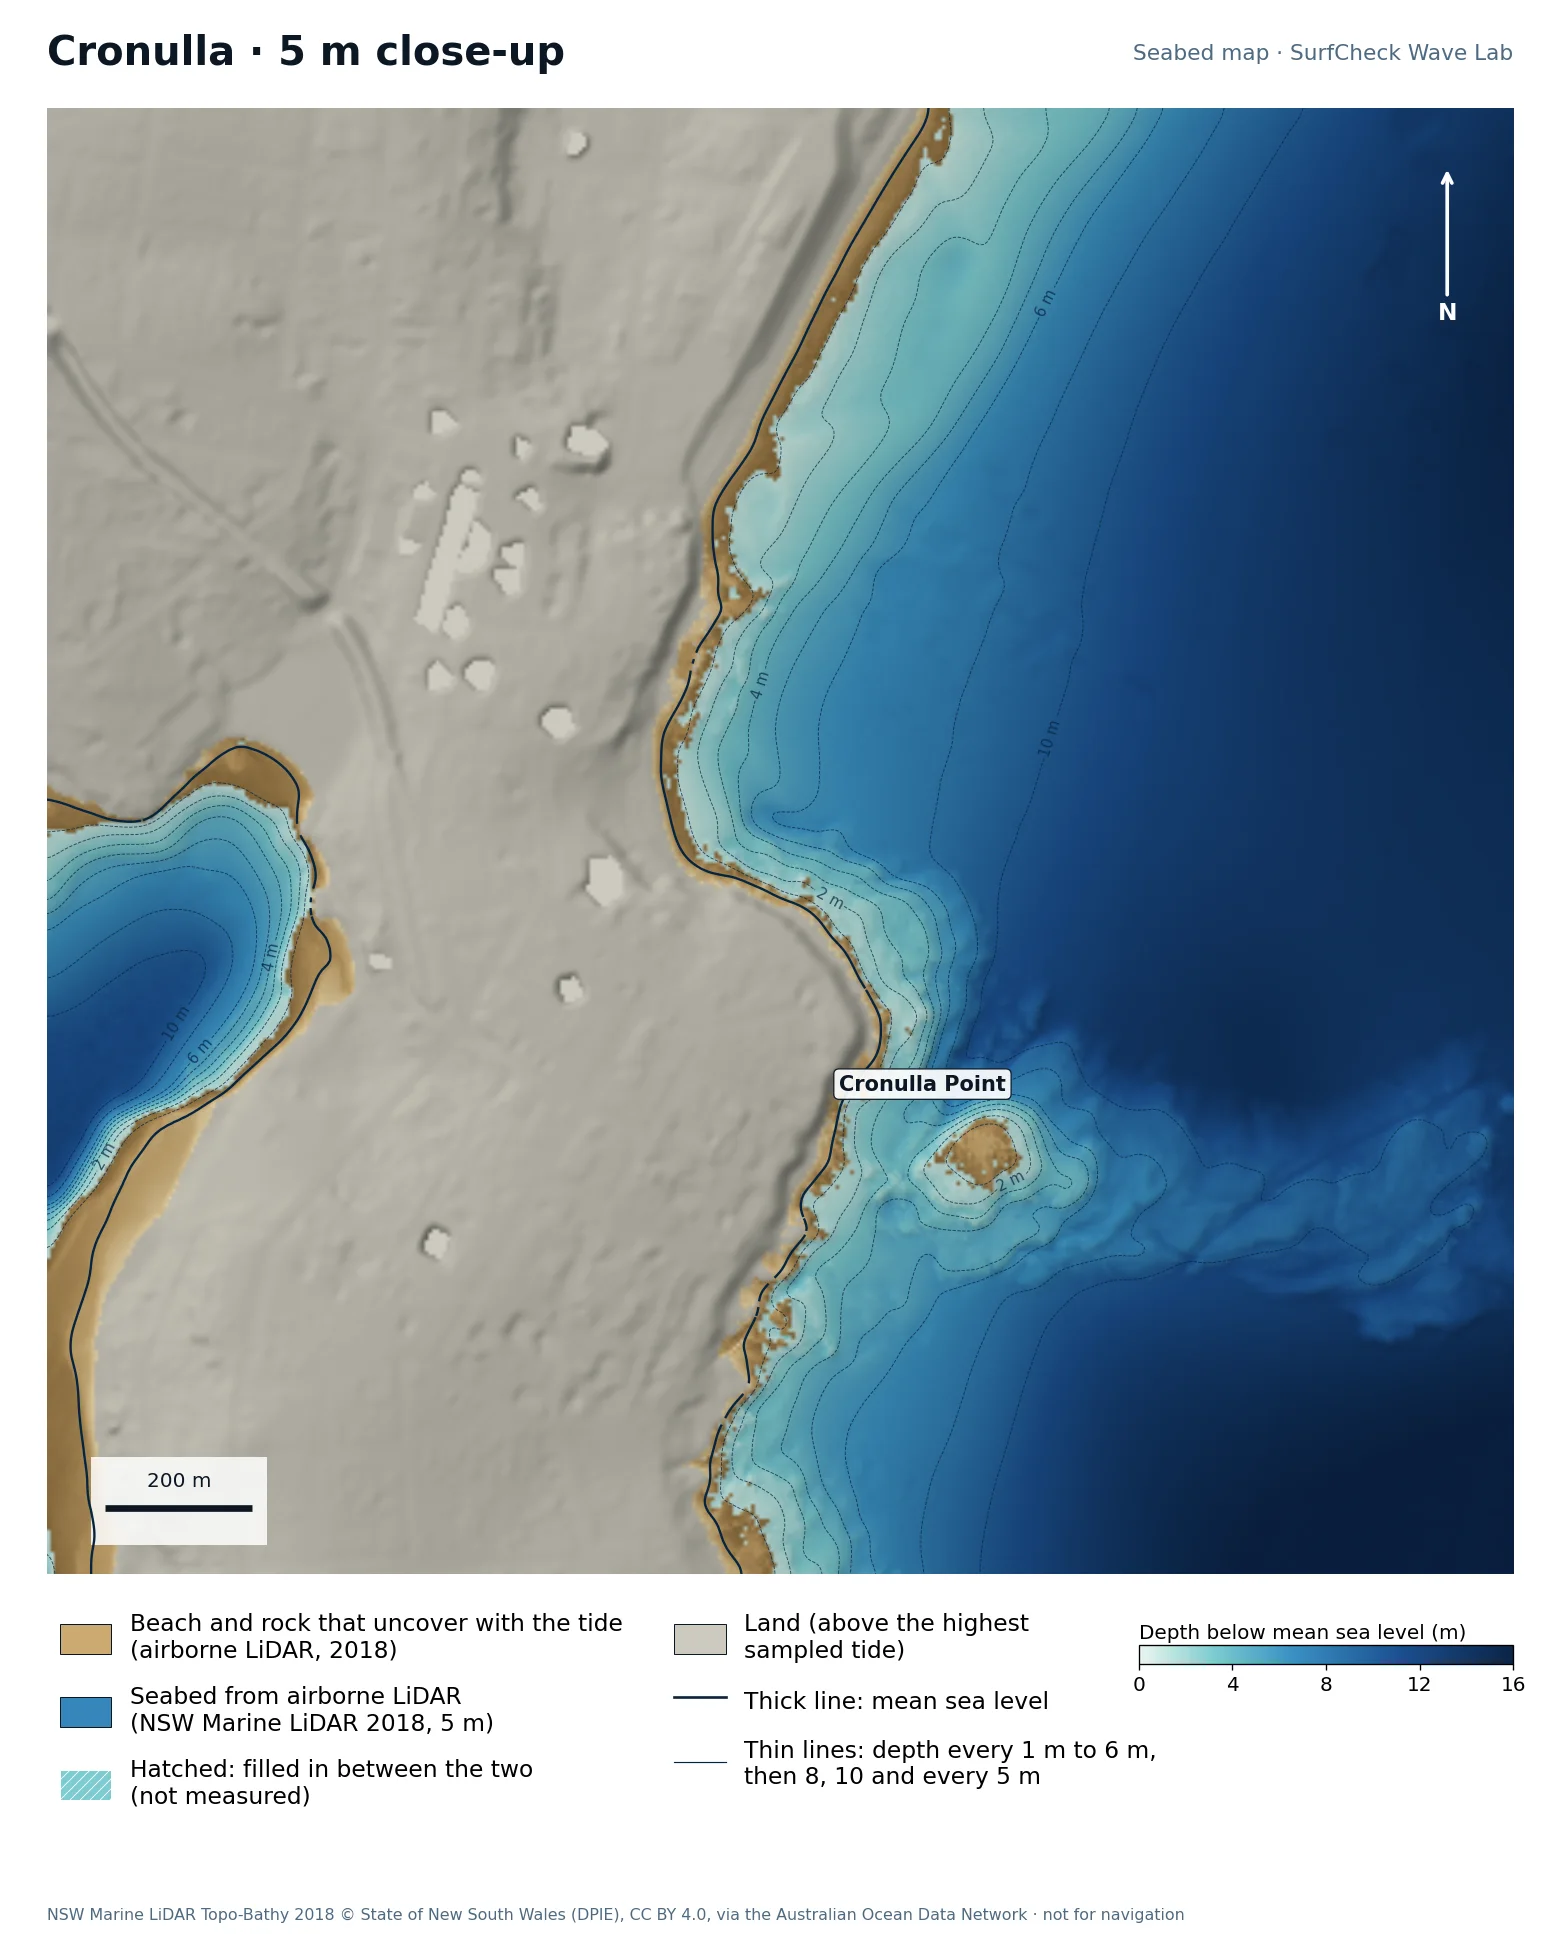
Run it in the Wave Lab

Sydney, New South Wales · Reef point and beach

Cronulla

Well measured
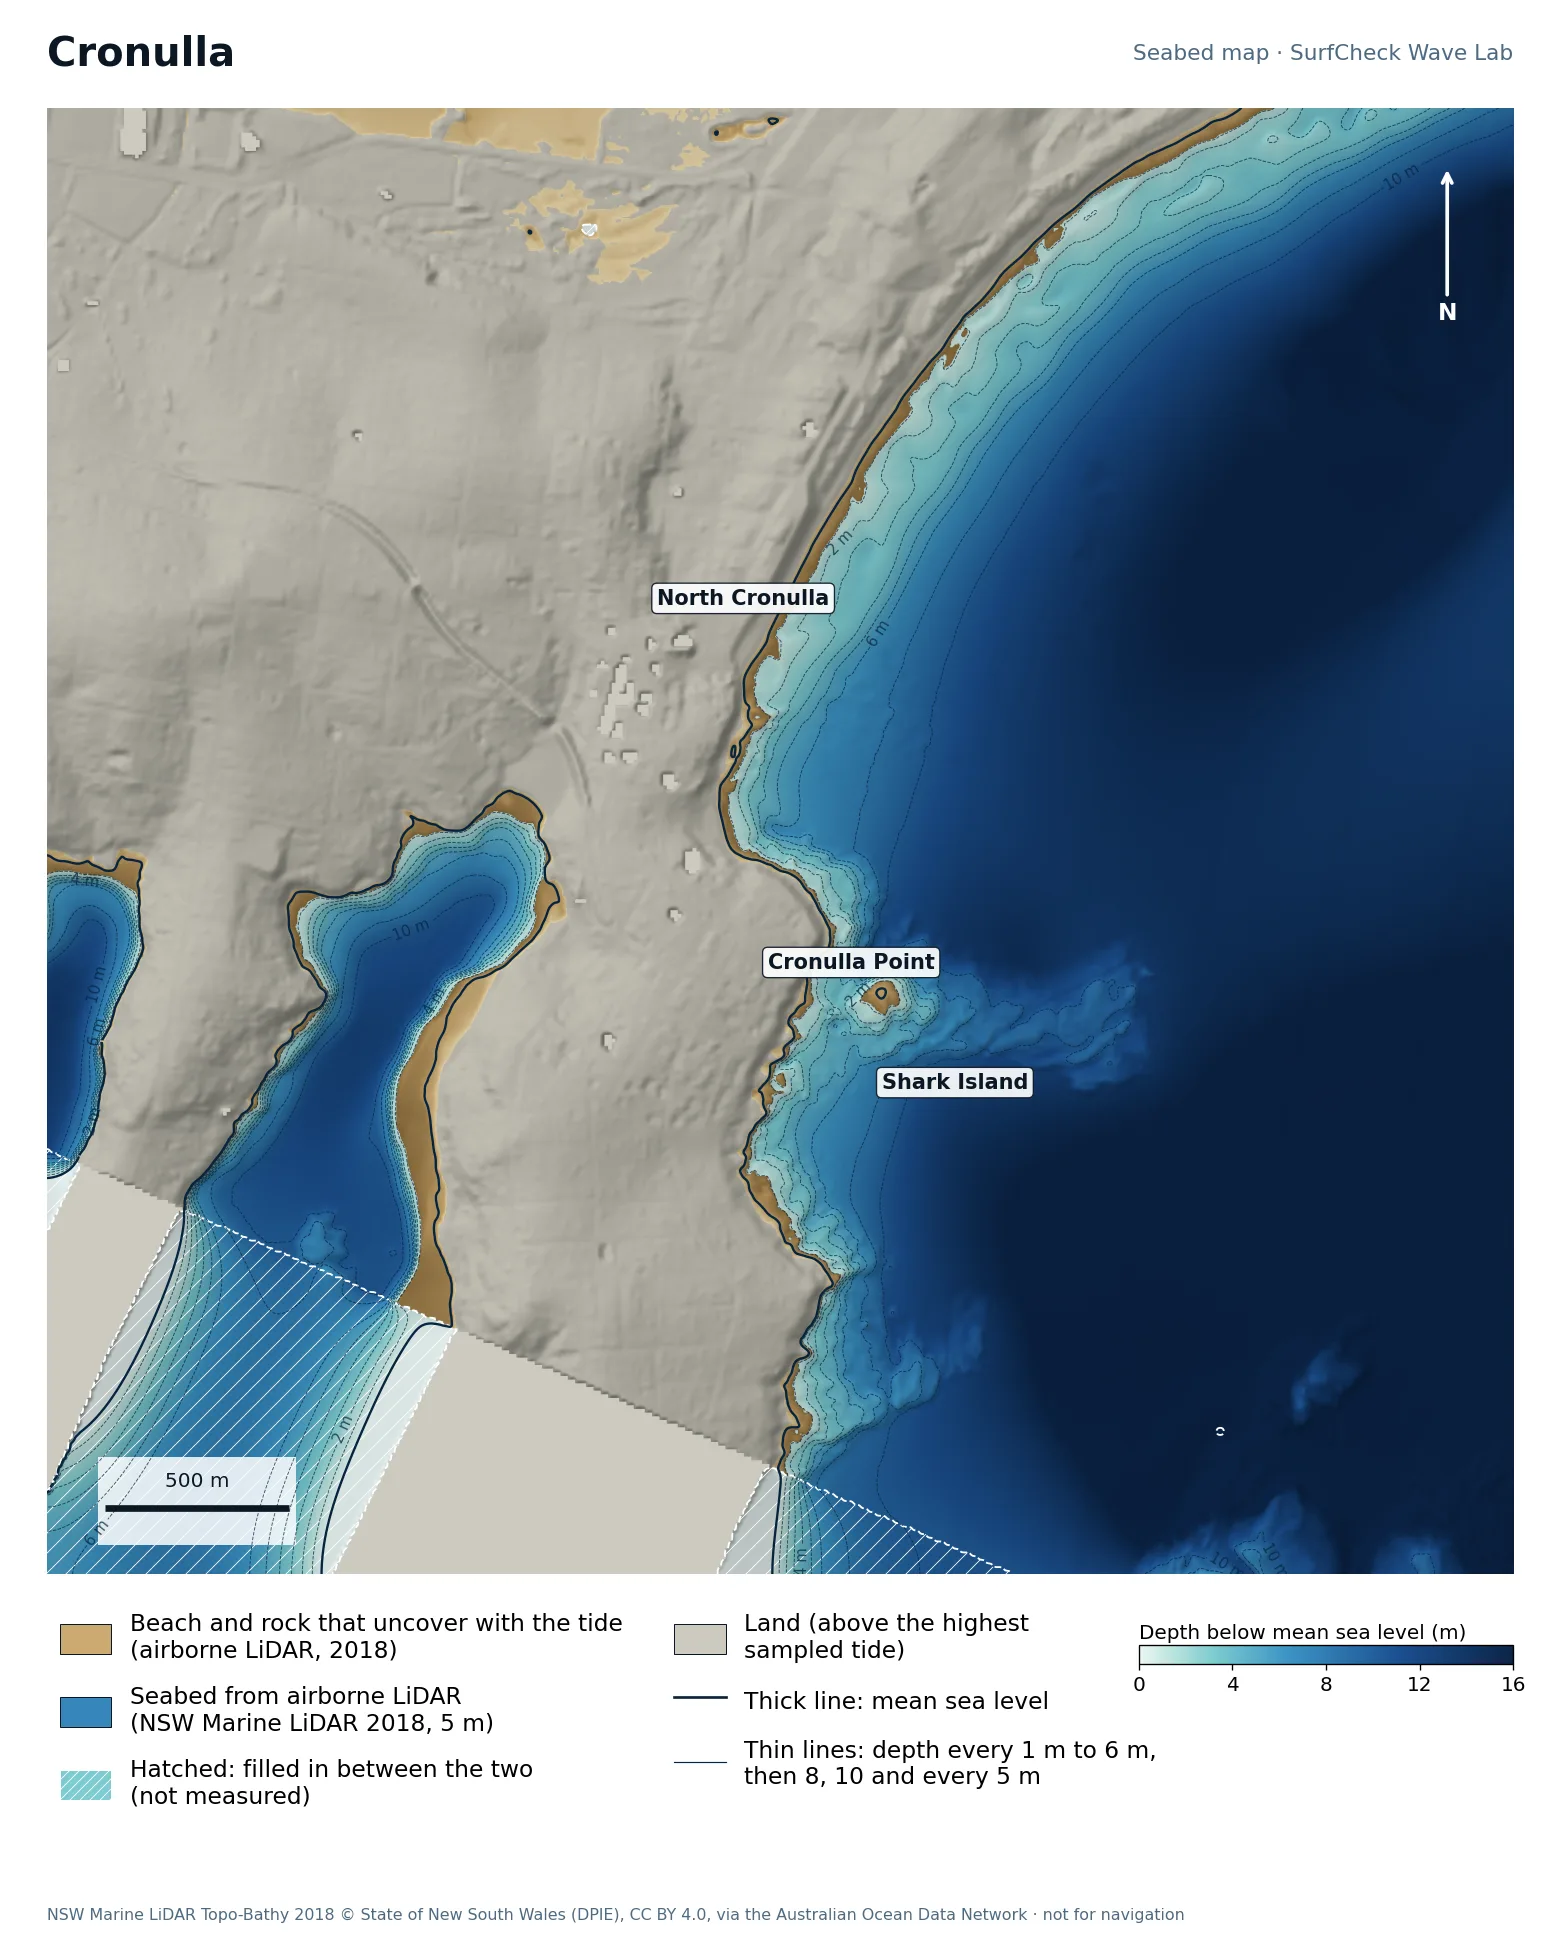
Seabed map of Cronulla: depth contours, the reef or beach that uncovers with the tide, and which parts are measuredClose-up of Cronulla in finer detail from LiDAR
91%
of the sea here is measured
49 ha
uncovers with the tide
5 m
airborne LiDAR, 2018
Offshore
only deep water is filled in

What the seabed shows

Cronulla Point and its reef ledges at the south end of the long Bate Bay beach.

How sure we are

91% of the sea in this map is measured. Beach and seabed both come from one airborne LiDAR survey flown in 2018, at 5 m, out to 20 to 40 m depth. Sand has moved since. The unmeasured part is deeper water offshore.

In the Wave Lab

Swell direction is too close to call: the model cannot separate directions that differ by less than about 30% in breaker size. Tide changes breaker size by under 4%.

Run it in the Wave Lab

Contains modified Copernicus Sentinel data 2018–2026. Seabed survey: INFOMAR, Geological Survey Ireland & Marine Institute (CC BY 4.0). Tide levels: Marine Institute, Irish National Tide Gauge Network. LiDAR at Bundoran: Geological Survey Ireland & the Office of Public Works (CC BY 4.0). Depths are relative to mean sea level; Irish survey depths are shifted from chart datum using each break's Marine Institute reference station (Sligo, Killybegs and Ringaskiddy 2.4 m, Dunmore East 2.5 m, Fenit 2.8 m, Galway 3.0 m). England: © Environment Agency copyright and/or database right 2022 (Open Government Licence v3.0). Contains United Kingdom Hydrographic Office data © Crown copyright and database right. Outside Ireland, satellite tide levels are from the Open-Meteo marine model (Open-Meteo.com). Offshore, and the fill at Lahinch, Portugal, Morocco and Portrush: EMODnet Digital Bathymetry (CC BY 4.0). Portugal shore: coastal LiDAR HR_Lidar_Centro (APA/DGT, 2011) via EMODnet, CC BY 4.0. These maps are not charts and must not be used for navigation. USA: NOAA National Centers for Environmental Information, Continuously Updated Digital Elevation Model (public domain). Australia: NSW Marine LiDAR Topo-Bathy 2018 © State of New South Wales (Department of Planning, Industry and Environment), CC BY 4.0, via the Australian Ocean Data Network.